Tracking your website traffic is a game-changer for growing your website and your business. I’ve been monitoring website traffic for over a decade, and I can tell you firsthand that Google Analytics 4 (GA4) is one of the most powerful tools available for this purpose.
When you set up GA4 on your website, you unlock incredibly helpful insights about your visitors. You’ll discover exactly how people find your site, what they do once they get there, which pages they view, and how long they stick around. It’s interesting data, sure, but beyond that it’s actionable information that can transform your digital strategy.
I’ve seen countless website owners dramatically improve their traffic by simply paying attention to their analytics. Whether your visitors are coming from Google searches, social media platforms, or referral links, understanding these patterns helps you make smarter decisions about where to focus your efforts.
In this guide, I’ll walk you through exactly how to track website traffic using Google Analytics 4. I’ll show you how to set everything up (it’s easier than you might think!), which reports actually matter, and how to turn all this data into real growth for your website.
In this article:
Tracking Website Traffic: Video Walkthrough
Why use Google Analytics to track website traffic?
Google Analytics tracks website traffic to provide insights into visitor behavior, traffic sources, and content performance. It helps identify audience demographics, measure campaign success, and optimize site performance for better engagement and conversions.
As a marketer or business owner, there are many benefits to being able to analyze your website traffic and where it came from. Here are some reasons for tracking your traffic:
- Better Understand Your Visitors – Tracking your traffic sources in Google Analytics can help you identify your unique visitors’ geographic location and which channels they use, so you can better understand them and their user behavior, provide targeted messages, and make improvements to your SEO strategies
- Measure Your Marketing Campaigns – If a campaign is built around driving traffic or completing actions on your website (called conversions), then you can measure its effectiveness
- Focus on Channels for Best Results – By identifying which channel performed the best in getting visitors to your site, you can focus on it more to get even better results
- Find New Content Topics – People from different channels might be interested in specific topics, so you can discover new content ideas by checking your traffic sources and engagement rate for each page, then using that traffic data to perform keyword research
- Identify Traffic Gaps on Your Site – You can identify which channel doesn’t perform well in attracting visitors, then optimize it to perform better
Now, let’s take a look at how to see website traffic statistics in Google Analytics and WordPress.
How to Track Website Traffic in WordPress
(Don’t have a WordPress site? Skip down to the next section.)
Many users find Google Analytics overwhelming. Setting it up on WordPress requires installing code, which is pretty intimidating for a lot of people.
Plus, you’ll have to be an Analytics expert to set up the tracking that you need, find the right reports inside the Google Analytics dashboard, and get the traffic data that you need for making decisions.
A much easier way of installing Google Analytics, setting up the tracking features you need, and viewing your traffic sources, page views, and other engagement metrics in WordPress is with MonsterInsights.
MonsterInsights is the best WordPress plugin for Google Analytics, and it makes using Analytics very easy. You don’t have to worry about hiring a developer or someone who knows analytics.
The plugin helps you quickly and easily add Google Analytics to your website without touching any code, set up advanced tracking, and then see the most important reports right inside your WordPress dashboard.
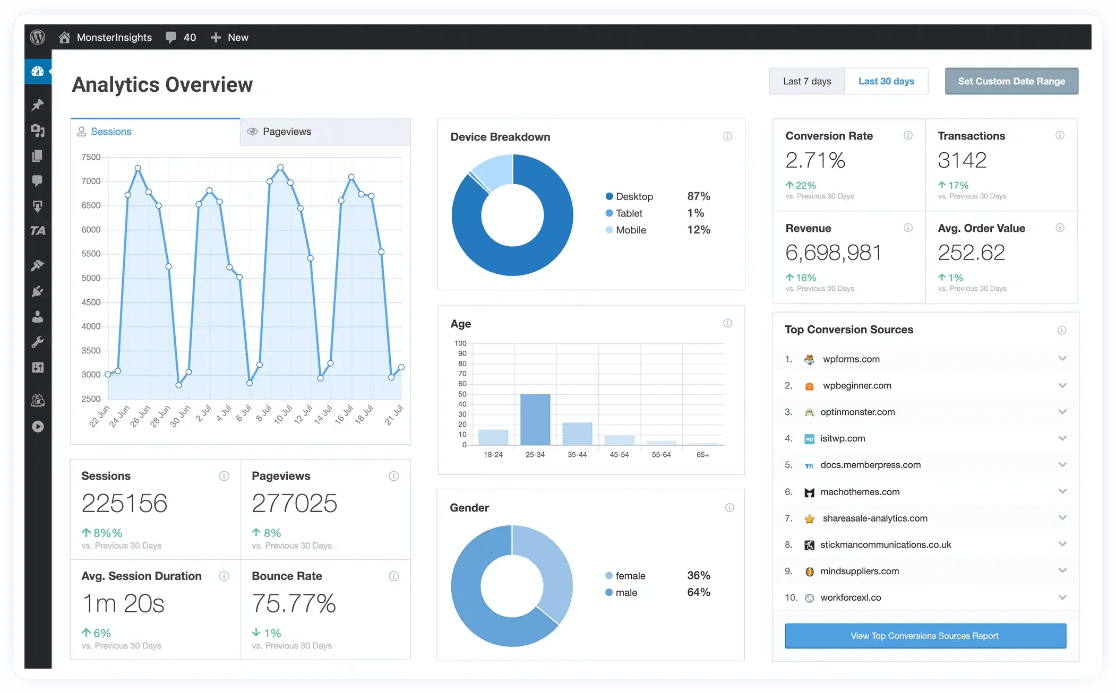
Although you’ll get more tracking features and reports with a MonsterInsights license, you can also check out the free Lite version if you’re just starting out. Once you’ve installed MonsterInsights on your website, you can see where your traffic is coming from.
For a full tutorial on getting set up with MonsterInsights, check out How to Add Google Analytics to WordPress the Right Way.
Track Your Website Traffic Now!
Check Website Traffic with These GA4 and MonsterInsights Reports
Overview Report
To start, go to Insights » Reports » Overview. Here you’ll find a traffic overview report and the overall performance of your website.
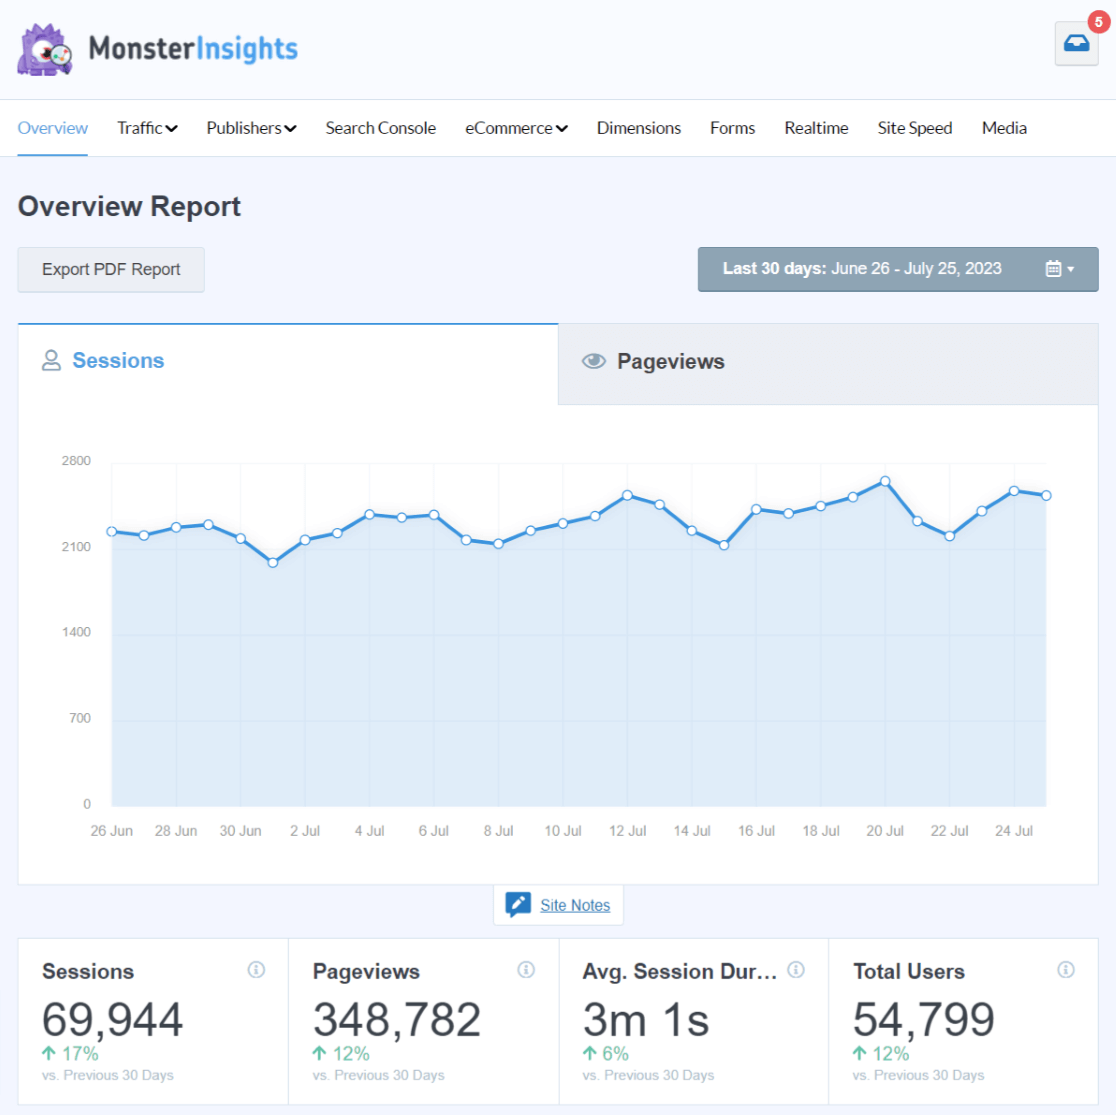
You’ll also see a Stats at a Glance section with all-time stats, the most popular times your website is visited, your most popular page and post, and more.

If you scroll down, you can see your New vs. Returning Visitors and Device Breakdown reports. These show you how many of your visitors are new vs. returning and which type of device they use.

In the Overview report, you can also view the Top 10 Countries that your users are from. Using this report, you can create campaigns, messages, and content according to different regions.

And next to countries, you can see the Top 10 Referrals report. This shows websites that send the most traffic to your site, including social media networks. You can form partnerships with these sites and continue to grow your traffic.

Wondering how to see pageviews on Google Analytics? At the bottom of the Overview report, you’ll find your top posts and pages.

Source/Medium Report
Where exactly is your traffic coming from? With the Source/Medium report inside MonsterInsights Plus or above, you can see which channels are sending visitors your way. Plus, you’ll see data for each channel like engaged sessions, conversion rate, and revenue.

Search Console Report
If your site gets some organic traffic, you should know which keywords it’s ranking for. MonsterInsights Plus and above offers a Search Console Report to help you find that out.
It shows your website’s top 50 Google search terms, along with clicks, impressions, CTR (click-through rate), and average position (keyword ranking).
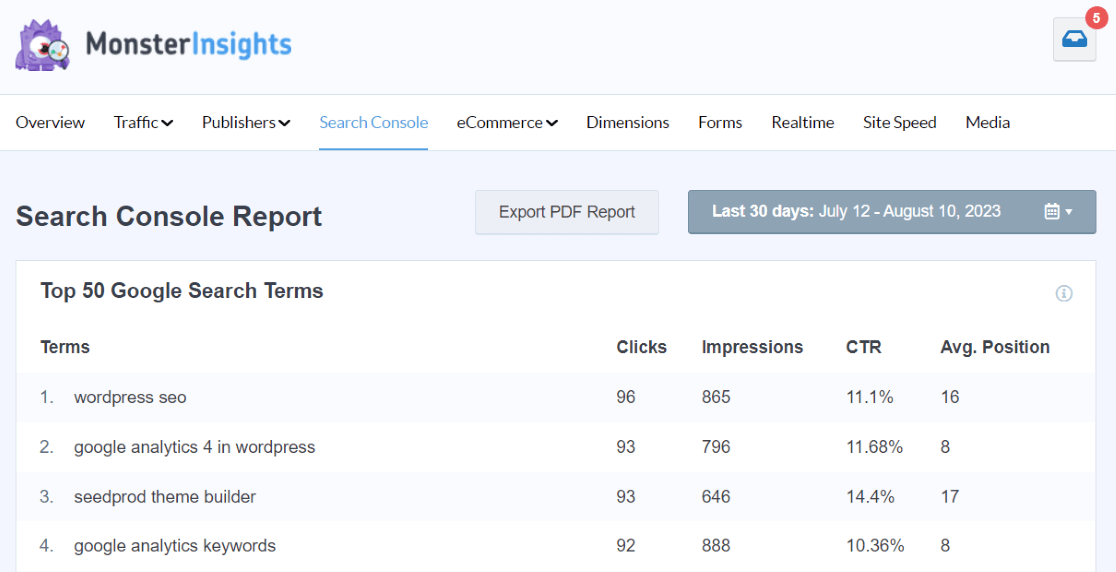
Since these are keywords that bring you the most organic traffic, you can do some keyword research and find similar search terms to optimize for on your site. You can even use them to think of new content ideas to boost your organic traffic and improve your overall marketing strategy.
For more details, check out our guide on how to configure your WordPress site with Google Search Console.
eCommerce Report
Do you have an eCommerce store and want to know what your shoppers are doing on your site? If yes, then the MonsterInsights eCommerce report can help you out.
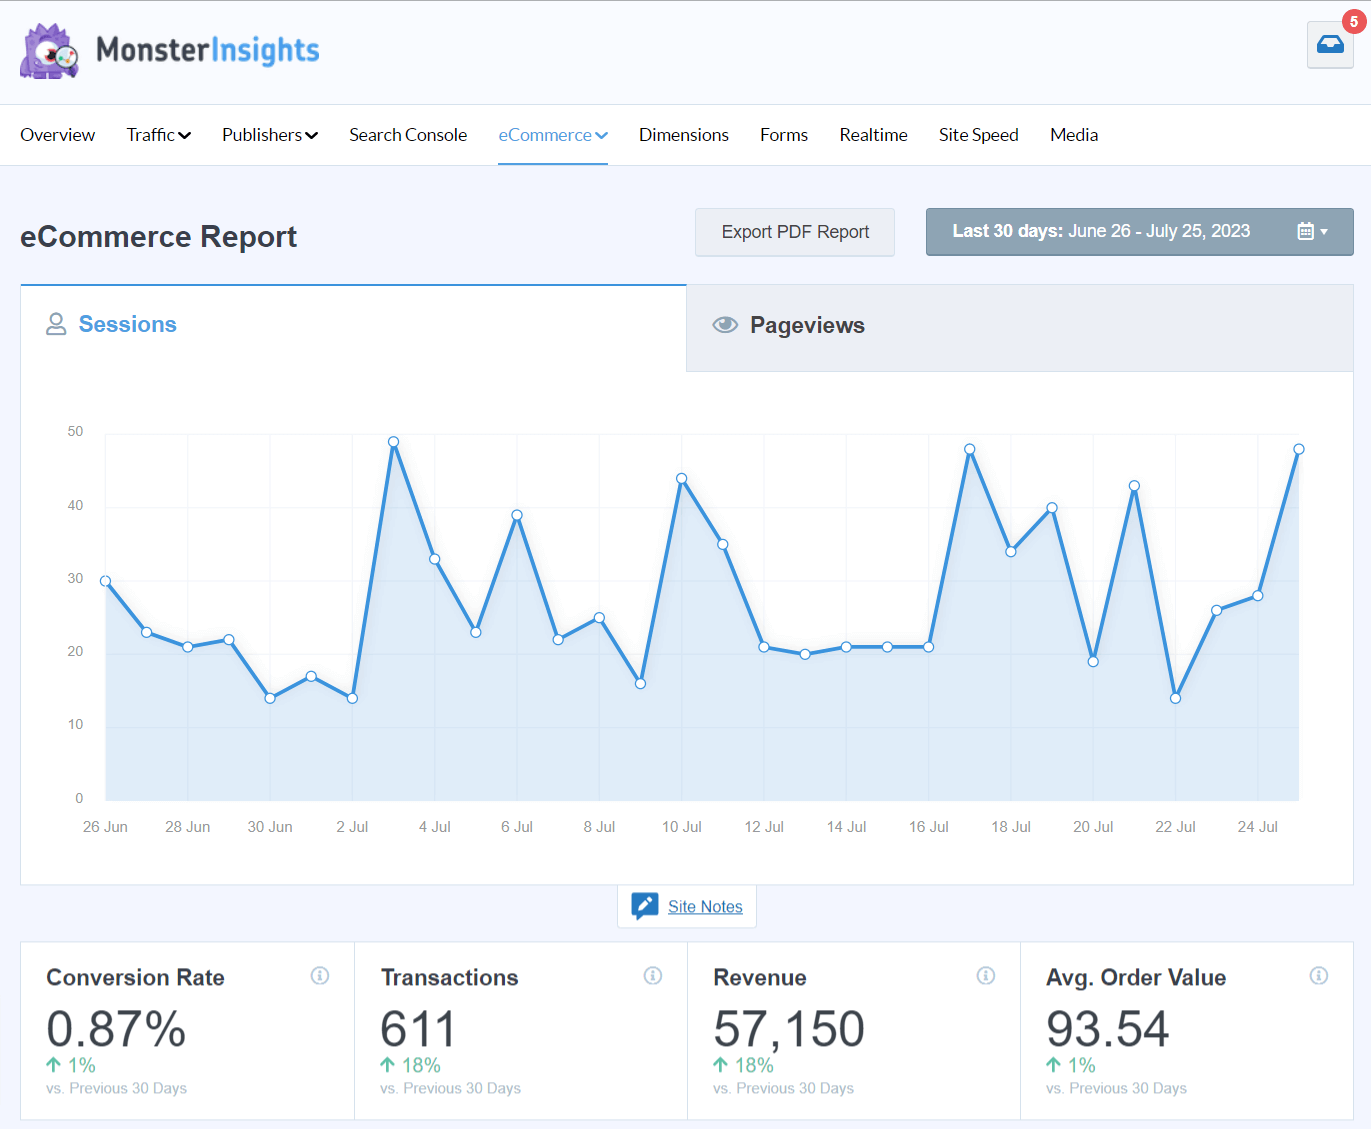
The MonsterInsights eCommerce report is available in MonsterInsights Pro.
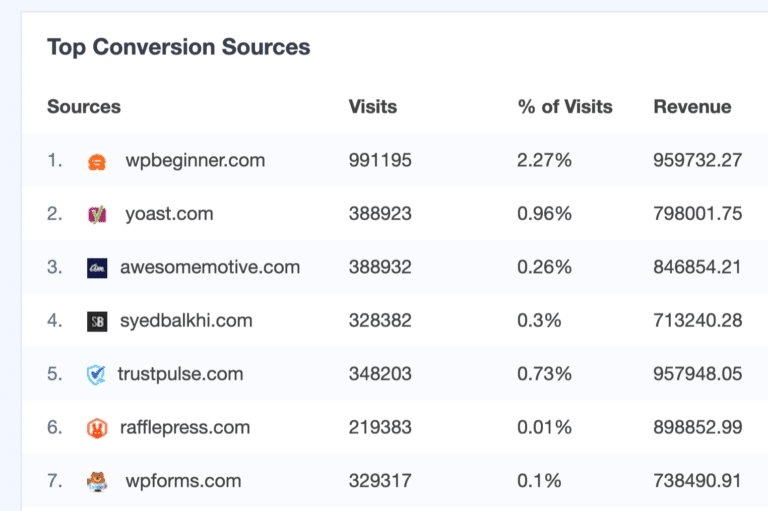
Beyond basic eCommerce metrics, it shows you the Top Conversion Sources for your website. You can see which websites send traffic that converts the best in your online store. Since people arriving from these websites buy your products, you can offer exclusive discounts and deals to make more money.
Realtime Report
Another report you can view for traffic stats is the realtime report. It shows you where your visitors are coming from in real-time. You can see web traffic analytics for referral sources, countries, and cities for users that are currently or have very recently been on your WordPress site.

This report is useful for checking website traffic statistics if you’ve just launched a new product or a marketing campaign and want to see where visitors are coming from.
Conversations AI
Conversations AI is a smart tool built right into your WordPress dashboard. It makes tracking your website traffic incredibly easy. Instead of searching through long reports or changing date settings, you can simply ask Conversations AI for the needed traffic information:

Whether you want to know which sources drive the most visitors to your site, the performance of a particular page, or the success of your latest marketing campaign, Conversations AI provides quick and accurate answers.
Get started with MonsterInsights Pro today and experience the convenience and efficiency of this powerful AI tool.
There’s more! You’ll also find multiple different Traffic reports, Publisher reports, a Forms report, a Site Speed report, and even more.
For all the details on what you’ll find in MonsterInsights, check out Your Ultimate Guide to MonsterInsights Dashboard Reports.
With that, let’s see how to find traffic sources in Google Analytics.
How to Track Website Traffic in Google Analytics
MonsterInsights offers user-friendly reports inside your dashboard, so you don’t have to leave your site. But what if you want to see where traffic is coming from in Google Analytics?
There are many reports that you can use to see website traffic statistics in Analytics. Having said that, it’s very easy to get lost.
To help you find the data that matters, you can start by logging in to your Google Analytics account.
You can start tracking your website traffic with Google Analytics 4 by navigating to Acquisition » Traffic Acquisition:

In this Google Analytics web traffic report, you can see which channels are driving the most traffic to your website. For instance, you can see the number of visitors from organic searches.
You’ll also be able to see how much traffic is getting referred from other sites, how much direct traffic you’re getting, and more.
To get a deeper look at exactly where your traffic is coming from, click the Session default channel group dropdown:
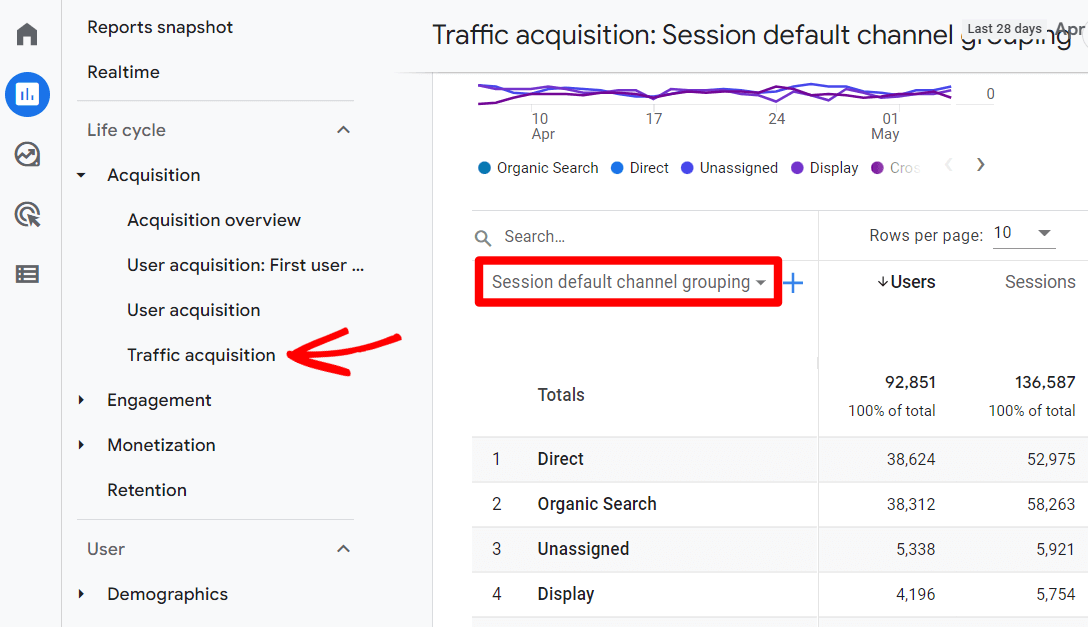
From there, select Session source/medium:

Now, you can see which search engines contributed to your organic traffic, which sites sent you referral traffic, and more.
Now that you know how to see where traffic is coming from for your overall website, what if you want to use Google Analytics to find traffic for specific pages?
Google Analytics Traffic Sources for a Specific Page
To find site traffic sources and other web traffic analytics for a specific page in Google Analytics 4, navigate to Engagement » Pages and Screens. In the table, you’ll see both Views and Users, so you can see how many views each page got and how many users completed those views.

To add source/medium to the report, click the plus icon above the Totals column. In the dropdown, choose Traffic source then Session source / medium.
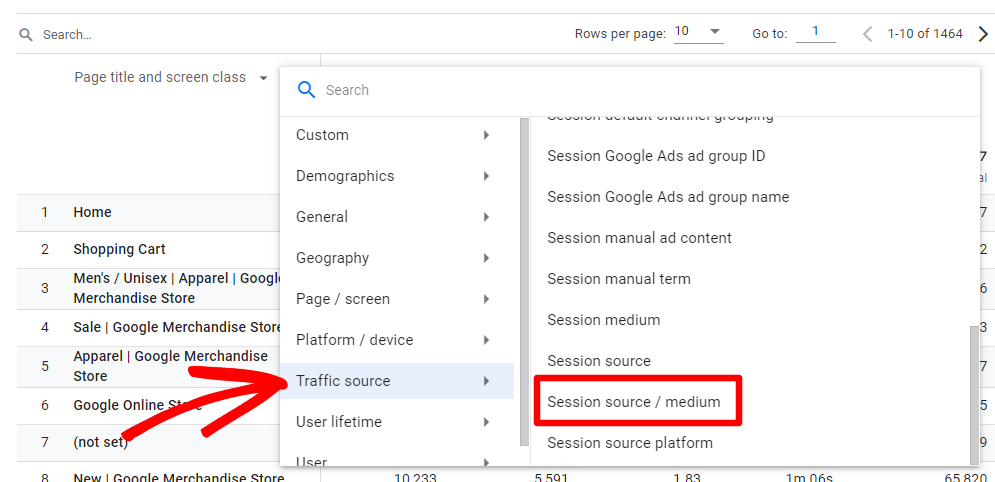
Now, you have a table of your pages by source/medium and views:

To change this table so you can view your landing pages by source/medium, scroll over to the Event count column. Click the down arrow next to All Events and select first_visit.

Then, click the Event count column title to sort by landing page visit events. Now you have your landing page visits report by source/medium.

For more ways to track website traffic in Google Analytics, check out the Top 11 Important Google Analytics Metrics to Track.
How to Track Website Traffic: Quick Tracking Tips
- Use Google Search Console. It gives you awesome keyword insights!
- Decide which Google Analytics reports and metrics are the most important to your website and keep track of them.
- Set up conversion tracking wherever you can. Conversions are what tell you if you’re reaching your goals.
How to Check Website Traffic on a Competitor’s Site
Now that you know how to see your own website traffic, are you wondering how to see a competitor’s website traffic? Here are a few tools you can use for that!
- Semrush: A popular SEO tool used for keyword research, competitor tracking, backlink tracking, organic keyword position tracking, and more.
- Ahrefs: A set of SEO tools similar in popularity to Semrush with a whole suite of tools for tracking website visitors and SEO effectiveness.
- SimilarWeb: Another popular website traffic checker tool for SEO professionals with a really handy Chrome extension and other SEO tools.
For more tools to track the amount of traffic your competitors are getting (including a couple of free website traffic checker tools), read 7 Website Traffic Checkers: How Much Traffic Does a Website Get?.
And that’s it!
Start Tracking Website Traffic Today!
I hope you liked this article on how to track website traffic using Google Analytics. You might also want to check out:
A Complete Guide to GA4 Conversion Tracking for WordPress
7 Website Traffic Checkers: How Much Traffic Does a Website Get?
How to Increase Organic Traffic This Year (12 Best Ways)
How to Track Competitor Website Traffic and Ethically Steal It
Finally, don’t forget to follow us on YouTube for more reviews, tutorials, and Google Analytics tips.
Website Traffic Tracking FAQ
How can I check traffic on my website?
To track traffic on your website, install Google Analytics and view your Acquisition and Engagement reports there. You’ll see what sources your traffic came from and what pages they visited.
If you’re using WordPress, install MonsterInsights to make setting up and viewing your Google Analytics data a breeze!
How do I get traffic to my website?
To increase traffic to your website, publish great content, optimize it for SEO, publicize your site on social media, and track your traffic in Google Analytics for more growth ideas.
For more ideas, check out 32 Marketing Hacks Guaranteed to Grow Your Traffic.
How do I find out how many visits a website has?
If you’re looking for traffic data for your own website, install Google Analytics to find out how many visits you get. If you’re looking for traffic data for a website you don’t own, use a website traffic checker tool.
Can you see how many people clicked on your website?
You can see how many people clicked on your website using Google Analytics. There you’ll see who clicked on your site from search results, other websites, social media, and more.

Thank you very useful,
can you explain what is ” (direct) / (none) ”
&
(not set)
means, it appears on google analytics under traffic source.
Hi,
Thank you for your feedback. When you see direct/none, it means that the traffic source is direct. For example, a user might have typed the URL of your website in the browser or open your site through bookmarks. For more details, check out our guide: https://www.monsterinsights.com/what-is-direct-traffic-in-google-analytics/
As for (not set), it means that Google Analytics wasn’t able to recognize the source of the traffic, but it recorded the users because they may have interacted with the website (like clicking a link). If you’re seeing a high number under the (not set) row, it could also mean spambots.
Please give some tips and updates..
Hi Cenon,
Can you please provide more details about which tips and updates you’re looking for? We’re here to help 🙂
For some reason my google analytics looks differently to what you describe 🙁
No Behavior, for instance.
Hi Ignat,
It could be that you’re using Google Analytics 4 and unable to see the Behavior report. You will need to set up a Universal Property to see the Behavior report. Please refer to our guide for step by step instructions: https://www.monsterinsights.com/how-to-properly-setup-google-analytics-in-wordpress/
Cheers!
I would like my website to get traffic.
Hi,
You can go through our guide to find ways to increase traffic on your website: https://www.monsterinsights.com/marketing-hacks-guaranteed-to-grow-your-traffic/
Does this allow capturing source ip information and the url that the source ip goes to?
Hey Arthur,
No it does not. Google Analytics does not gather IP addresses due to privacy concerns.
hi,
is there a way to see/analyze exactly, where each visitor was, exact pages.
like, landing page>home>page1>page5> etc
Hey Jack,
Thanks for stopping by. That’s a great question! If you’re just wondering in general how users are navigating your site, check out the Behavior Flow report in Universal Analytics, or in GA4, try Path Exploration.
If you’re looking for information on specific users, you can see which pages they visited by tracking logged in users.
Is traffic acquisition real time or delayed by any amount of time. I have heard that it has about a 36 hour delay. Any insight you can send my way is appreciated.
Hi Jenn,
Google Analytics says it takes 24-48 hours, but most simple metrics (like sessions and pageviews) are available within an hour or two. There’s also the real-time report, where you can watch users interacting with your site in real time.
Is it possible in Google Analytics to track the exact source of the traffic? For example, can we track whether the traffic is coming from Facebook, LinkedIn, Twitter, Instagram, or even Google Ads?
Yes it does! The MonsterInsights Top Referrals report will include social media networks, like this: https://www.monsterinsights.com/wp-content/uploads/2021/10/social-referrals-1.png. For all the sources, head to the Traffic Acquisition report in GA4: https://www.monsterinsights.com/wp-content/uploads/2020/06/ga4-traffic-acquisition-2.png
I have noticed whatever realtime daily user showing in analytics, if we calculate user day by day time frame for 30 days, and other directly 30 days.. there we are getting difference in user number. This is why, can you please explain me..? We are getting more user number in day to day frame rather than directly 30 days frame.
There is a difference in numbers when you’re viewing reports on a per day basis versus viewing reports within the last 30 days because of how Google Analytics queries data for each report.
A site visitor can visit your site on Day 1 and then leave on Day 2. In a day to day view, Google Analytics recognizes that this visitor visited your website on both days.
When you view this same visitor’s site activity within the last 30 days, Google Analytics looks at the data cumulatively, in which case, they consider the visitor only having visited once.
If you have more questions, let us know! If you’re a MonsterInsights customer, you can reach out to support via our Lite Support form: https://www.monsterinsights.com/lite-support/
Or within your account if you use a paid plan: https://www.monsterinsights.com/my-account/support/
Thank you!
Hello, can we see a graph of traffic from just 1 particular page? I used to do this by clicking on a particular page in UA but the pages arent clickable in GA4
That’s a very good question. GA4 does not have a graph by time for pageviews. You can isolate one page by using the Search bar on the Pages and Screens page, but it won’t show you a graph. If you want a line graph like in Universal Analytics, you’ll have to create an Explore report and make it a line graph: https://d.pr/yGgbjA
Thank you for sharing this informative post. This post also deserves positive feedback.
How in the world do you track pages only from your blog, in GA4? For Example; example.com/blog/???? There is no dimension/filter/etc. If you create a report for page path, you only get that ONE page, not subsequent pages behind it.
Hey Scott – Putting those reports together can be so confusing! For this one, if all of your blog posts have /blog/ in the URL, you can add a “contains” filter like this: https://a.supportally.com/i/420N3T.
How to download the data by day wise in GA4?
Hey Rajesh – There’s no “day of the week” dimension anymore in GA4, but you can at least look at a day-by-day report by creating a custom report like this one: https://a.supportally.com/i/qaAY86
This guide on using Google Analytics segments to pinpoint traffic sources is incredibly insightful! The step-by-step instructions and clear examples make it easy to understand and apply. Thank you, MonsterInsights, for providing such valuable content to enhance our analytics skills.