


No single channel gets the sale. GA4 gives you three attribution models, and each one splits credit for the same purchase differently — the disagreement between them is the useful part, because it points straight at the channel you’ve been underfunding.
That’s especially useful if you’re not running paid ads. Maybe your traffic comes from organic search, email, social, and one affiliate, plus a stubborn pile of Direct traffic you can’t quite explain. You can see the sales happening. You just can’t always tell what caused them.
This tutorial walks through the three attribution models GA4 actually offers today, shows you where to find the comparison reports (and why yours might be missing), and explains the one thing about Direct traffic that no model will ever fix for you.
In This Article:
- The 3 GA4 Attribution Models You Can Actually Use
- Where to Find the GA4 Attribution Reports (and Why Yours Might Be Missing)
- How to Compare GA4 Attribution Models — Option 1: With an Advertiser Link
- How to Compare GA4 Attribution Models — Option 2: Without an Advertiser Link
- What GA4 Attribution Paths Show You About the Full Multi-Channel Journey
- Which Marketing Channel Gets the Sale? Turning GA4 Attribution Into a Decision
- Why Your GA4 Attribution Numbers Don't Match Your Traffic Acquisition Report
- What to Do If You Don't Have Enough Data for GA4 Data-Driven Attribution
- Multi-Channel Attribution for WooCommerce and WordPress Sites
- FAQs About Multi-Channel Attribution in GA4
The 3 GA4 Attribution Models You Can Actually Use
Multi-channel attribution in GA4 solves one specific problem: when a customer touches three or four channels before buying, which one gets the credit? Attribution models are GA4’s rule sets for splitting credit for a key event — GA4’s name for a meaningful action like a purchase or a form submission — across every channel in that path.
Each channel is just a bucket GA4 sorts your traffic into, like Organic Search, Email, or Direct. If you want the full list and how GA4 decides what counts as which, see our guide on what Google Analytics channels are.
Before you compare models, it also helps to already have ecommerce sales tracking set up in Google Analytics — attribution only works on data you’re actually collecting.
As of November 2023, Google retired four older models — first click, linear, time decay, and position-based — leaving exactly three you can select today. Here’s what each one does with that same multi-touch path.
GA4’s Data-Driven Attribution Model (Recommended)
Data-driven attribution is GA4’s default model for event-scoped reports, and it’s the one Google labels “recommended” in the settings. Instead of a fixed rule, it uses your own account’s data to estimate how much each touchpoint actually contributed to the key event — so a channel that shows up in most of your winning paths gets more credit than one that rarely does.
GA4’s Paid and Organic Last Click Model
Paid and organic last click gives 100% of the credit to the last channel a visitor touched before the key event, as long as that channel wasn’t Direct. It’s the model most people picture when they hear “last click” attribution, and it’s the easiest one to explain to a business partner in one sentence.
GA4’s Google Paid Channels Last Click Model
Google paid channels last click credits the last Google Ads touchpoint in the path. If there’s no Google Ads click anywhere in that path, GA4 falls back to paid and organic last click instead. That means for a store running zero Google Ads, this model always produces the exact same numbers as the one above it.
For a no-ad-spend site, that leaves two models actually worth comparing, not three — and that’s exactly what the next few sections walk you through.
Where to Find the GA4 Attribution Reports (and Why Yours Might Be Missing)
GA4 keeps its attribution reports inside the Advertising section of the left-hand navigation — but showing up there doesn’t guarantee you’ll see them. Google splits Advertising into two categories, and only one of them unlocks attribution: advertiser reports, which require linking Google Ads, Campaign Manager 360, Display & Video 360, or Search Ads 360 to your property.
Publisher ads — AdMob, Google Ad Manager, and AdSense — sit in the other category, and none of them unlock attribution reports. If you monetize through AdSense and nothing else, you can open Advertising and still find it empty of anything about channel credit.
Here’s what that area looks like once an advertiser link exists and the Attribution reports have something to show.
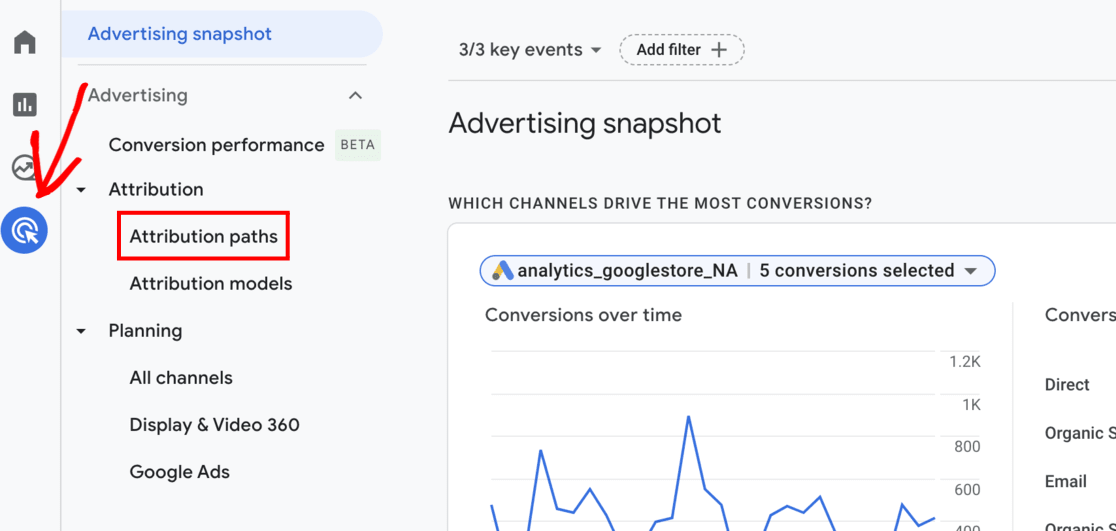
If your own Advertising section doesn’t show anything like this, the fix isn’t a plugin setting — it’s linking an actual advertiser account, which not every small site wants to do just to see one report. Option 2, later in this guide, is built for exactly that situation.
One more thing worth knowing: once an advertiser link is active, you’ll actually see more than the two reports this tutorial focuses on. GA4 also lists Key event performance, Conversion performance, and Conversion attribution models in the same area. This guide sticks to the two that directly answer “which channel gets the sale” — Key event attribution models and Key event attribution paths.
How to Compare GA4 Attribution Models — Option 1: With an Advertiser Link
If you’ve got an advertiser link, open your GA4 property and head to Advertising, then look for Attribution in the left-hand menu — that expands into Attribution models and Attribution paths. Google renamed this from Model comparison a while back, so if an older article or your own memory says “Model comparison report,” this is the same place.
The Key event attribution models report lets you pick any two of your three usable models to compare, each in its own dropdown, plus a single % Change column showing the gap between them. Pick the key event you care about — Purchase, if you’re running WooCommerce — set your date range to at least a full month so you’re not reading noise, and set the two dropdowns to Data-driven and Last click, since Google paid channels last click won’t tell you anything new without ad spend.

Scan that % Change column channel by channel. Any channel with a big swing between data-driven and paid and organic last click is the one whose real contribution doesn’t match what last click alone would have told you — and that’s the number worth writing down before you move to the next report.
From there, click through to Key event attribution paths using the Key events dropdown in the same Attribution area. This report shows the actual sequences — which channels showed up early, in the middle, and right before the purchase — capped at 20 touchpoints per path.
How to Compare GA4 Attribution Models — Option 2: Without an Advertiser Link
No advertiser link means no Key event attribution models report — but you can still compare models. GA4’s reporting attribution model is a single setting that applies to your entire property, and switching it changes how every event-scoped report calculates credit, going backward and forward in time.
You’ll find it under Admin, then Data display, then Events, then Attribution settings. If you land on a different Google help page first, don’t second-guess yourself if it calls this same click “Key events attribution” instead — Google’s own documentation isn’t consistent about the name, but it’s the same screen either way. There’s no side-by-side view here, so the only way to compare models is to record your numbers, switch, and record them again.
Start with whatever model is currently selected and write down your key events and revenue by channel for the last 30 days. Don’t reach for the Traffic acquisition report here — it’s session-scoped, so it won’t move no matter which model you pick. Instead, build a Free-form exploration using the plain Default channel group dimension (not “Session default channel group,” which is the wrong scope) alongside Key events and Total revenue. Then switch the Reporting attribution model to data-driven, wait for the data to recalculate, and pull the exact same exploration for the exact same date range.
Because the change is retroactive and property-wide, everyone else who uses this property will see the new model too — so this isn’t something to flip back and forth on a whim. And since Google paid channels last click is a no-op without an active Google Ads account, you’re really only comparing two models here: data-driven and paid and organic last click.
Here’s roughly what that settings screen looks like once you’re in the right spot.

Click that dropdown and the options are grouped — Paid and organic channels gives you Data-driven or Last click, and Google paid channels gives you Last click only. Data-driven, under Paid and organic channels, is the one Google recommends and the one worth comparing against your current setup.
Once you’ve got both sets of numbers, put them side by side yourself — a spreadsheet or even a notes app works fine. Here’s the kind of table you’re comparing, built with Default channel group in the rows and Key events and Total revenue in the values.

Notice AI Assistant in that channel list — Google added it as a Default channel group value in May 2026 to capture traffic arriving from tools like ChatGPT and Perplexity. If it’s new to you, that’s because it is.
The channels that moved the most between your “before” and “after” numbers are the ones whose real contribution last click was hiding from you.
If you want to see how visitors moved through your site’s key events in more detail once your model is set, our guide to GA4 funnel exploration reports covers that next step.
Before You Flip the Switch
The Reporting attribution model is one setting for your whole property, it’s retroactive, and there’s no side-by-side view — so record your numbers before you switch, not after.
What GA4 Attribution Paths Show You About the Full Multi-Channel Journey
The Key event attribution paths report is the closest thing GA4 has to a channel-by-channel story of a single sale — early touchpoints, mid touchpoints, and the late touchpoint that led straight to the purchase, all capped at 20 touchpoints per path.
Here’s a real example, broken into early, mid, and late touchpoints with a path table underneath.

Notice Direct dominating the late-touchpoint column — that’s expected, not a bug. Direct only earns credit when the entire path is Direct, which is also why it shows up as its own single-touchpoint row further down the table.
That table’s model dropdown defaults to paid and organic channels last click, and you can switch it. Google doesn’t document whether that dropdown is tied to your property-wide setting, so treat the two as separate controls rather than assuming one drives the other.
“Direct” also shows up two different ways in GA4, and the two are easy to blur together. As a channel, it means no attributable source — the visitor typed your URL or used a bookmark. As a value in the paths table, it can also mean there’s a data-import row with no path data at all.
Neither one means the sale came from nowhere; it usually means UTM tagging never told GA4 where it came from. For more on that distinction, see our guide on what direct traffic means in Google Analytics.
For a full breakdown of building and reading paths across every touchpoint — not just the ones tied to attribution credit — see our guide on how to track conversion paths in Google Analytics, which covers that in more depth than we will here.
Which Marketing Channel Gets the Sale? Turning GA4 Attribution Into a Decision
Here’s the actual decision this whole comparison is for: find the channel whose share of credit changes the most between last click and data-driven, and treat that as the channel you’ve been underfunding.
Say email shows up as the last click for a small slice of your purchases, but data-driven credits it with a much bigger share once GA4 accounts for every earlier touchpoint. That jump means email is quietly doing more work than your last-click numbers ever showed — probably by warming up visitors who convert later through a different channel. A channel that moves the other way, credited less under data-driven than under last click, is one you’ve been overcrediting.
This works even on a small store. Forty or fifty orders a month is plenty of data to see a real swing, especially once you’re comparing a full month or more.
One channel you’ll never see move in this comparison is Direct. Every model excludes Direct from getting credit unless the entire path was Direct, so its share stays essentially flat no matter which model you pick.
If Direct is your biggest bucket — and for a lot of small sites, it is — this exercise won’t shrink it. That’s a UTM tagging problem, not an attribution model problem.
For the single-touch version of this same question, see our guide on which Google Analytics traffic sources convert best — useful context before you dig into the multi-touch numbers here.
The fix for a bloated Direct bucket is making sure every link you share — email newsletters, social posts, affiliate placements — carries a UTM tag GA4 can actually read. MonsterInsights, the WordPress analytics plugin, has a Smart URL Builder that does exactly that without you needing to memorize UTM syntax — it’s the most direct way to stop revenue from defaulting into Direct in the first place.
Here’s what building one of those links looks like inside WordPress.

Once your links are tagged correctly, that revenue starts showing up under the channel that actually earned it — email, social, or whichever campaign sent the click — instead of piling up in Direct.
Stop Losing Revenue to a Bloated Direct Bucket
MonsterInsights’ Smart URL Builder creates properly formatted UTM links in a few clicks, so the revenue you just traced in GA4 keeps showing up under the right channel — not Direct.
Build Clean Tracking LinksIf email is one of the channels you’re trying to credit correctly, our guide on setting up Google Analytics email tracking and our beginner’s guide to UTM parameters both walk through the tagging side of this in more detail.
Why Your GA4 Attribution Numbers Don’t Match Your Traffic Acquisition Report
If you’ve compared your attribution numbers against Traffic acquisition and gotten two different stories, that’s not a bug — it’s dimension scope, and GA4 documents it plainly once you know to look.
Traffic acquisition and User acquisition are session-scoped and user-scoped reports. Both always use paid and organic last click, no matter what you’ve set in Attribution settings, because your model choice only affects event-scoped dimensions and reports.
Here’s what that session-scoped view looks like — sessions by channel, unaffected by your attribution model setting.

Your Key event attribution models report, on the other hand, is fully event-scoped — which is exactly why switching models changes numbers there and does nothing here.
There’s a second surprise waiting once you switch to data-driven: decimals. Key events, Total revenue, Purchase revenue, and Total ad revenue can all show fractional values, like 3.4 purchases instead of a whole number.
That’s not a data error. Data-driven attribution can split credit for one purchase across two or three channels, so a channel that contributed part of the path gets part of a purchase, not a whole one.
One date to keep in mind if you’re pulling a long comparison window: rules-based models have data going back to June 14, 2021, but paid-and-organic data-driven attribution only has data from November 1, 2021 onward. Anything before that date will look thin under data-driven for reasons that have nothing to do with your traffic.
Different Reports, Different Math
Traffic acquisition never changes when you switch attribution models — it’s session-scoped, not event-scoped. If two GA4 reports disagree, check scope before you assume something’s broken.
What to Do If You Don’t Have Enough Data for GA4 Data-Driven Attribution
A number you’ll see repeated across a lot of GA4 content — 400 key events, 20,000 paths — doesn’t actually exist in Google’s current documentation. That figure comes from Universal Analytics’ old multi-channel funnels feature, a discontinued product with a completely different threshold: 10,000 paths over 28 days, and only on the paid Analytics 360 tier.
Google Ads’ current position on data-driven attribution is the opposite of a hard cutoff: every conversion action is eligible for data-driven attribution regardless of volume. Google does recommend at least 200 conversions and 2,000 ad interactions within 30 days for the model to work well — but that’s a recommendation, not a requirement, and nothing in GA4 blocks you from using data-driven attribution below it.
What actually happens on low data is subtler than a hard fallback: GA4 doesn’t quietly switch you to last click behind your back. If your data-driven and last click numbers look nearly identical, that’s usually because your traffic doesn’t have much data to work with yet, not because GA4 swapped models on you without telling you.
One setting worth checking while you’re in Attribution settings is your key event lookback window, since it decides how far back GA4 looks for a key event’s touchpoints.

GA4 uses three different defaults here: 30 days for acquisition key events like first opens, 90 days for every other key event, and just 3 days for engaged-view key events. None of these changed recently. If you’ve read that the window dropped from 90 days to 30 days, that’s a misread of these three tiers, not an actual change.
So if your numbers look thin, the fix isn’t switching models again — it’s giving GA4 more time and more key events to work with, and trusting the comparison once you’ve got at least a full month of steady data.
Multi-Channel Attribution for WooCommerce and WordPress Sites
How WooCommerce’s Built-In Order Attribution Compares to GA4
If you run WooCommerce, you already have a second attribution system running in parallel with GA4 — Order Attribution, built into WooCommerce core. It works differently enough from GA4 that the two won’t always agree, and knowing why keeps you from chasing a discrepancy that isn’t actually a bug.
Per WooCommerce’s current documentation, Order Attribution uses its own last-click logic with a few specific override rules. A UTM-tagged or organic source always overrides whatever source came before it. A direct, type-in visit never overrides a source that’s already been identified.
A referral source only overrides the previous one if there’s no active visitor session, which runs on roughly a 30-minute cookie window. That’s closer to last-non-direct-click than a pure last click, even though WooCommerce doesn’t use that term itself.
There’s also a feature gap worth knowing about. The full Order Attribution report needs the separate WooCommerce Analytics feature. Without it, core WooCommerce only gives you an Origin field on each order’s edit screen and an Origin column on the Orders table — fine for looking up one order, not for a channel-level report.
For the complete setup — connecting GA4 to WooCommerce correctly in the first place — see our WooCommerce conversion tracking guide. And if you’re setting up UTM-tagged campaigns to feed both systems cleanly, our guide on marketing campaign tracking in Google Analytics walks through that setup.
Keeping Multi-Channel Attribution Data Visible Inside WordPress
GA4 does the actual attribution modeling — MonsterInsights doesn’t duplicate that math or reallocate credit between channels. What it does is keep the traffic-source-to-revenue read you just built in GA4 visible inside your WordPress dashboard, so you’re not logging into GA4 every time you want to check it.
The eCommerce Report shows total revenue, conversion rate, average order value, top products, and your best traffic sources for sales, all in one wp-admin view — a Pro-plan feature for WooCommerce or Easy Digital Downloads stores.
Here’s what that looks like once eCommerce tracking is turned on.

It’s the closest thing to a running “which channel earned this” answer you can check without opening GA4 at all.
User Journeys, also on Pro, shows every page a customer visited — and how long they spent on each one — before they bought. That’s a page path within your site, not a cross-visit channel path, so don’t confuse it with the attribution paths report from earlier in this guide. It’s a different, complementary answer: not which channel earned the sale, but what they actually read before deciding to buy.

Together with what you already learned from GA4’s attribution reports, that gives you both halves of the story — which channel brought them, and what convinced them once they landed. For a deeper look at on-site journey analysis specifically, see our ecommerce customer journey analytics guide for WordPress.
If you’d rather not read a report at all, Charlie Chat lets you ask your analytics a direct question — something like how much revenue a channel brought in last month — and get back an answer with a Recommended Action and a shortcut to the report behind it. It’s available on every plan, including the free Lite version.

It won’t pick an attribution model for you — that’s still a judgment call you make with the reports above — but it’s a fast way to check the numbers those reports are already showing you.
Two more reports worth checking once your UTMs are clean: the Source/Medium Report and the Campaigns Report, both available on the Plus plan. They break traffic down by exact UTM values, which is the fastest way to confirm your tagging is landing the way you intended.
If a channel you expected to see, like a specific email send, isn’t showing up as its own row there, that’s usually a UTM problem, not a tracking problem.
The Campaigns Report does the same thing one level up, at the campaign level instead of source and medium. Between the two, you can confirm your tagging is intact before you trust anything GA4 attributes to it. If you haven’t set up UTM tagging yet, start with our beginner’s guide to UTM parameters.
See Which Channel Actually Earned the Sale, Without Leaving WordPress
MonsterInsights Pro adds the eCommerce Report and User Journeys, so the channel-and-revenue read you just built in GA4 stays one click away inside your dashboard.
Try MonsterInsights ProFAQs About Multi-Channel Attribution in GA4
Why doesn’t my GA4 attribution report match my Traffic acquisition report?
They’re built on different dimension scopes. Traffic acquisition is session-scoped and always uses paid and organic last click, no matter what you’ve set in Attribution settings. Your attribution models report is event-scoped, so it’s the only one that actually changes when you switch models.
What should I do if I don’t have enough key events for data-driven attribution in GA4?
There’s no official minimum, despite what a lot of GA4 content claims. Google recommends at least 200 conversions and 2,000 ad interactions in 30 days for the model to perform well, but every key event is eligible regardless of volume. If your numbers look thin, give it more time and more data before switching models again.
Which attribution model should I use in GA4?
For most small sites, data-driven attribution is the one to trust — it’s Google’s recommended model, and it’s built to reflect your actual traffic instead of a fixed rule. Paid and organic last click is worth keeping around as a comparison point, since the gap between the two tells you which channel last click was underselling.
Why can’t I find the attribution reports in my GA4 property?
They live in the Advertising section, but only the advertiser-report category unlocks them — that means linking Google Ads, Campaign Manager 360, Display & Video 360, or Search Ads 360. Publisher ads accounts like AdSense don’t unlock attribution, even though they also show up under Advertising.
Why does GA4 show decimals instead of whole numbers for my purchases?
That happens under data-driven attribution, which can split credit for a single purchase across more than one channel. Key events, Total revenue, Purchase revenue, and Total ad revenue can all show fractional values as a result — it’s how the model represents partial credit, not a data error.
Does WooCommerce’s built-in order attribution do the same thing as GA4?
Not quite. WooCommerce’s Order Attribution uses its own last-click logic with override rules based on a roughly 30-minute session window, which behaves closer to last-non-direct-click than GA4’s models do. The two systems can disagree on the same order, and that’s expected rather than a sign something’s broken.
Can I still use first-click attribution in GA4?
No — first click, along with linear, time decay, and position-based attribution, was removed from GA4 in November 2023. If you’re seeing tutorials that still walk through picking first-click as an option, they’re describing an interface that no longer exists.
Attribution won’t hand you one tidy number — it hands you the gap between what last click says and what data-driven says, and that gap is where your next budget decision actually lives. If you liked this article, check out the following beginner-friendly guides:
- Google Analytics Reports: The Ultimate Guide (GA4)
- How to Track Website Traffic Using Google Analytics 4
- WooCommerce Conversion Tracking: Complete Guide
- A Beginners Guide to UTM Parameters (And How to Use Them)
- What Are Google Analytics Channels? GA4 Channels Guide
Follow us on Twitter, Facebook, and YouTube for more Google Analytics tips.