What are the most important Google Analytics metrics you can measure, and what can you use that data for?
If you have a website, you’ve probably heard of Google Analytics. It’s a pretty standard tool that website owners use to see how many people are visiting their websites and what they’re doing while they’re there.
If you’re not yet using Google Analytics or just getting started, you’re probably looking for some basics on what Analytics can track and what it can tell you about your website and your visitors.
In this article, we’ll take a look at the top 11 most important Google Analytics metrics you should track to grow your traffic and your business. But first, I’ll go over a little background info on metrics and a super easy way to set up Google Analytics on a WordPress site.
What is a metric in Google Analytics?
In Google Analytics, a metric is a number that measures different ways users engage with your website, such as sessions, pageviews, and engaged sessions. Metrics measure user activity and engagement on your website, providing insights into performance and user behavior.
I’ll show you my top Google Analytics metrics below. But first, here’s a super easy way to connect Google Analytics and WordPress.
Don’t have WordPress? Skip to the metrics.
Connect Google Analytics and WordPress
If you have a WordPress website, the hands-down easiest way to install and connect Google Analytics is with the MonsterInsights plugin.
MonsterInsights is the best Google Analytics plugin for WordPress. MonsterInsights makes it incredibly easy to connect Google Analytics with your site and see straightforward, uncomplicated reports about your traffic.
Besides bringing the most critical metrics from Google Analytics right into your WordPress dashboard, MonsterInsights makes it extremely easy to track eCommerce stats, form submissions, link clicks, video plays, and so much more.
To see all the features and plans, visit MonsterInsights’ Pricing page.
Get Started with MonsterInsights Today!
The Top 11 Google Analytics Metrics for Websites
Now, let’s get into our list of the top website metrics you can track with Google Analytics. You’ll also see how to find many of these reports right inside the MonsterInsights dashboard in WordPress, saving you the trouble of opening Google Analytics.
Google Analytics Metric #1: Overall Traffic and Traffic Sources
How many people visited your site in the last week?
How many of those people came to your site by clicking a link on Facebook or on another site?
Those are the kinds of questions you can answer with the Google Analytics traffic sources report. Not only will it give you the total traffic to your site, but it’ll also break it down by how those people found your site.
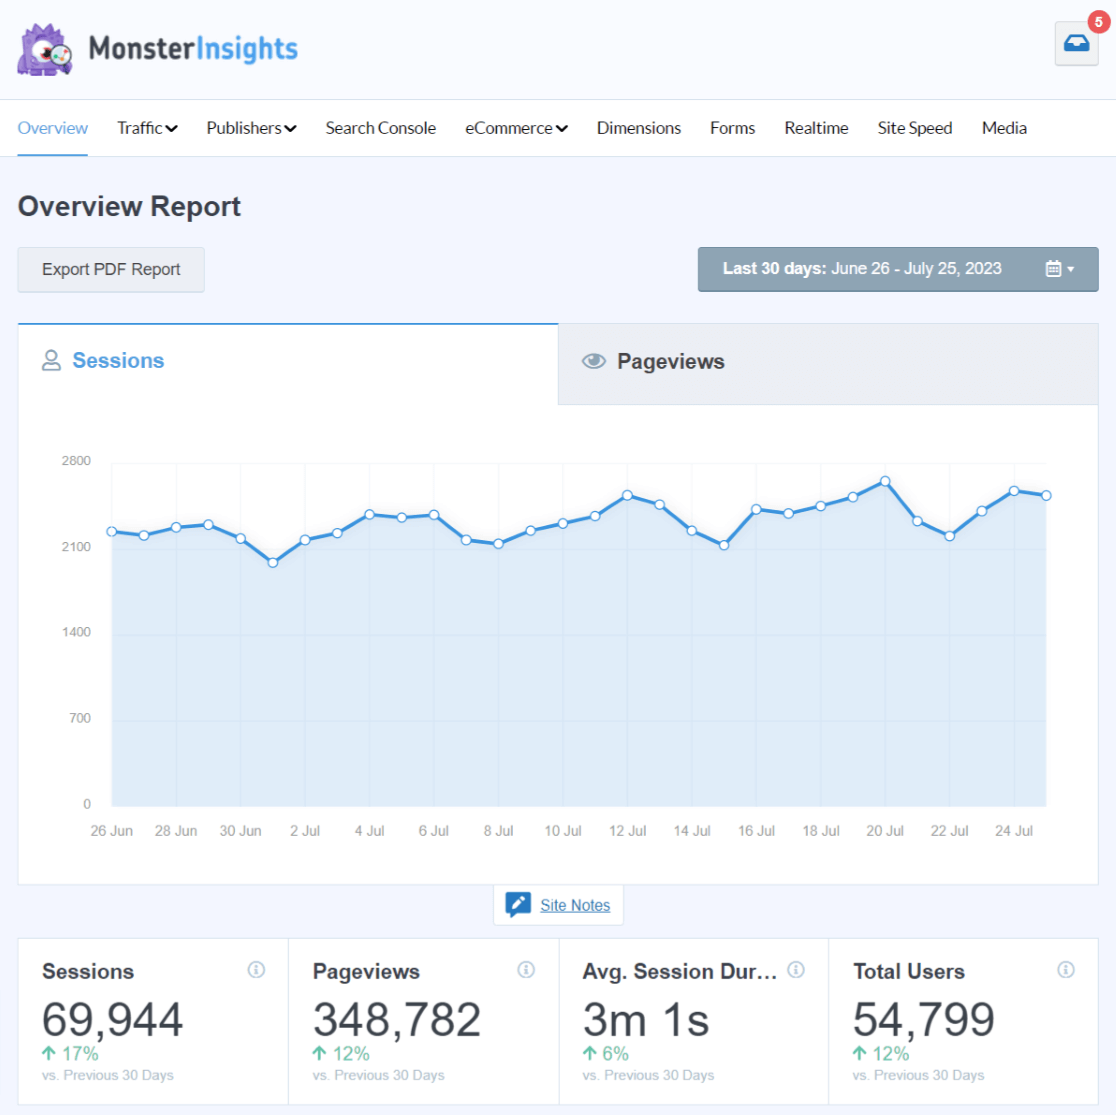
In MonsterInsights, find your overall traffic in the Overview report:
For traffic sources, head to the Traffic » Overview report:
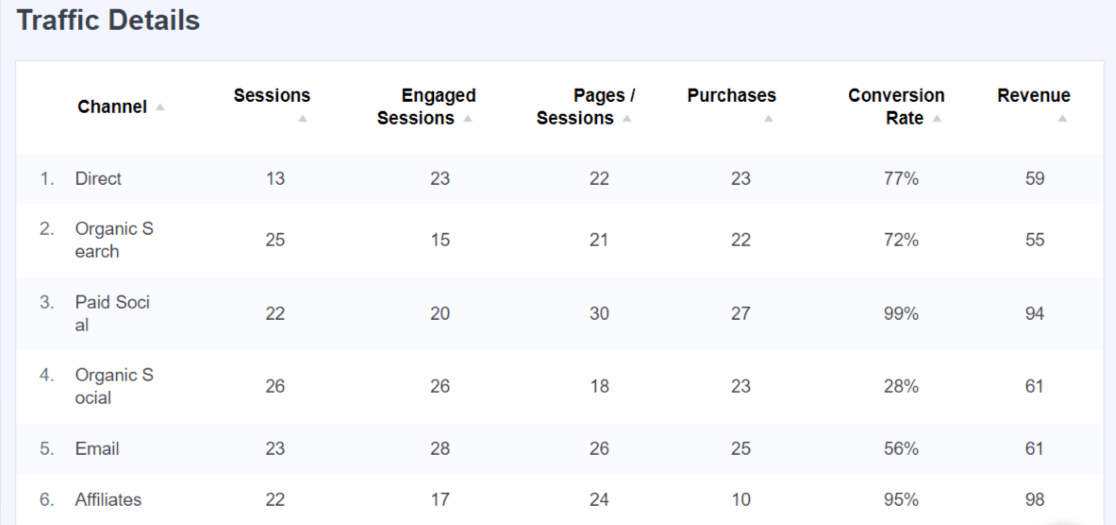
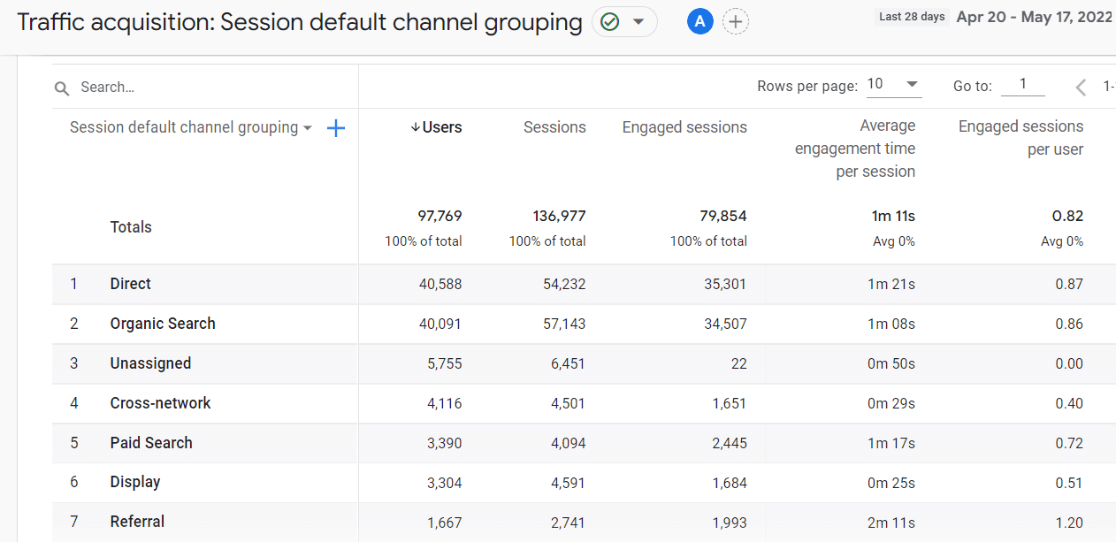
To access the traffic sources report in Google Analytics, go to Reports » Acquisition » Traffic Acquisition. Here, you’ll see an overview report about how your traffic came to your site:
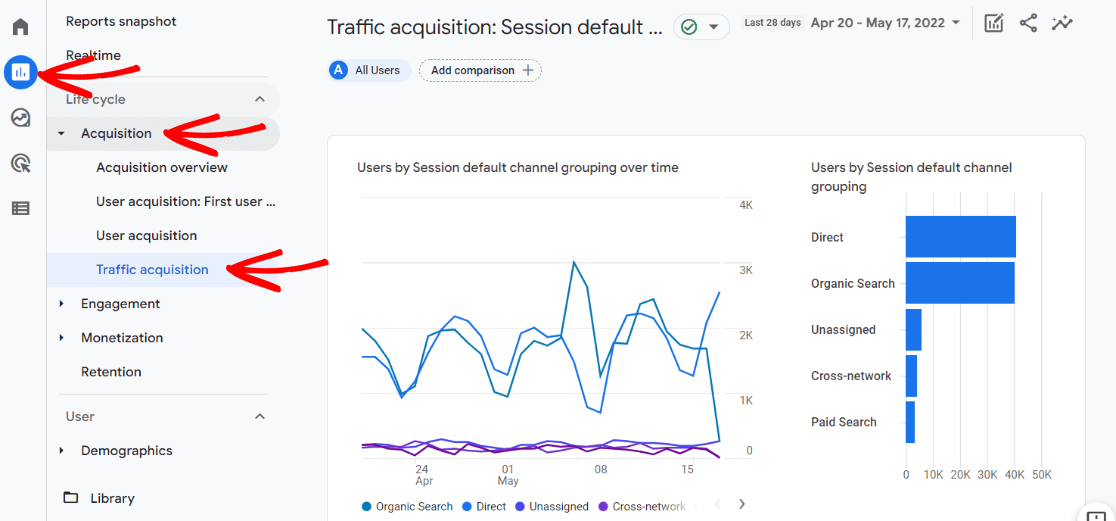
Scroll down to the table to see more specifics and metrics for each channel. Hover over a heading (Engaged sessions, for instance) for a helpful tooltip about what the metric means.
Google Analytics Metric #2. Audience Location
Whether you’ve got international traffic or your visitors are more local, the Demographics report can help you get a good idea of where your website visitors are located. This can help you decide which areas to target with your content or ads.
In MonsterInsights, find your top countries in the Overview report:
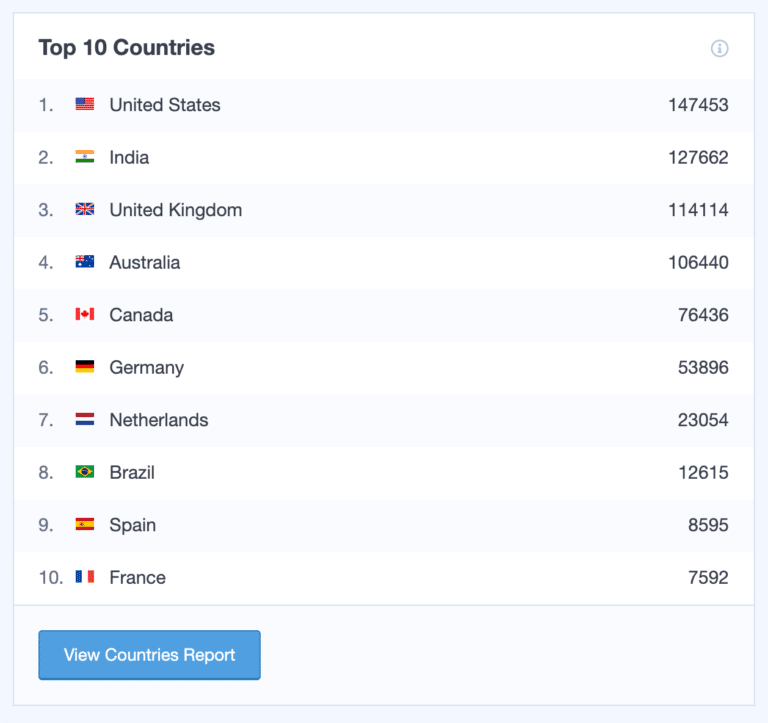
Or to drill down into regions, head to Reports » Publishers » Country:

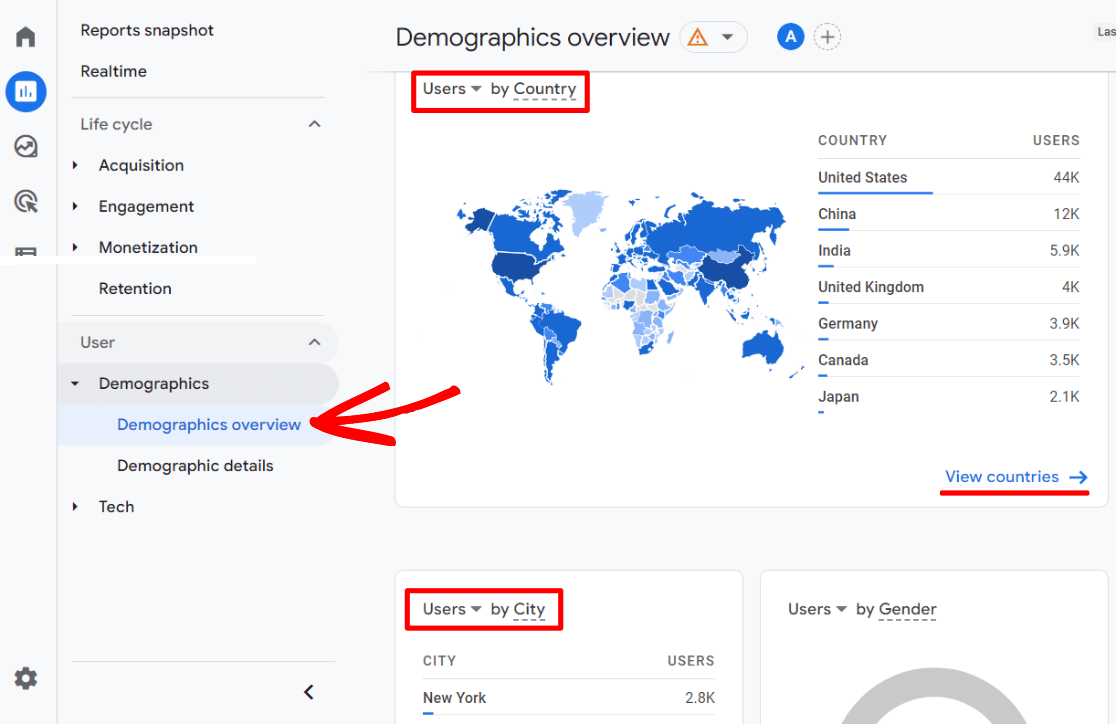
In Google Analytics, navigate to Reports » Demographics » Demographics overview. The card at the top displays users by country, and there’s a card underneath that one that shows users by city. Click the link to view countries or cities on the card – whichever one will help you the most.
Google Analytics Metric #3. Landing Pages
Which pages on your site are visitors landing on? Finding out which pages people are entering your site on can help you gain a lot of insights, such as:
- What keyword(s) your website is ranking for
- Which links people are clicking on from your social media profiles
- Which landing pages lead to the longest website visits
- What content resonates the most with your audience
In MonsterInsights, find a Landing Page Details report in the Traffic tab:
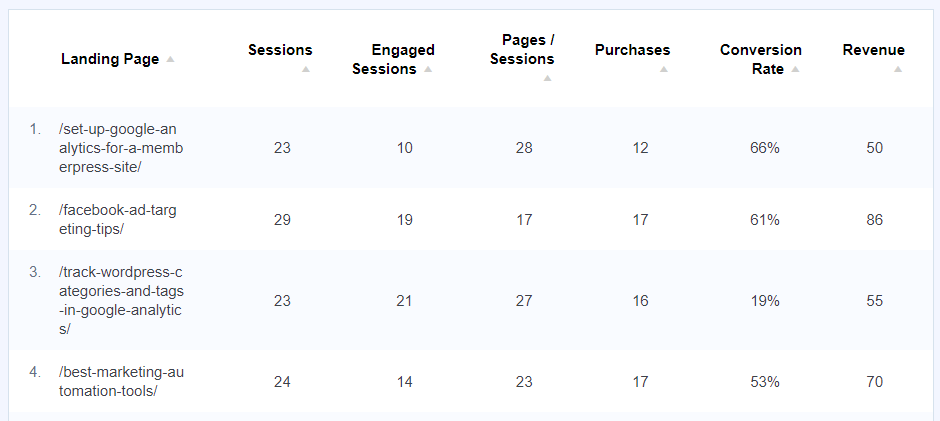
In Google Analytics, you’ll find a Landing page report under Engagement » Landing page:
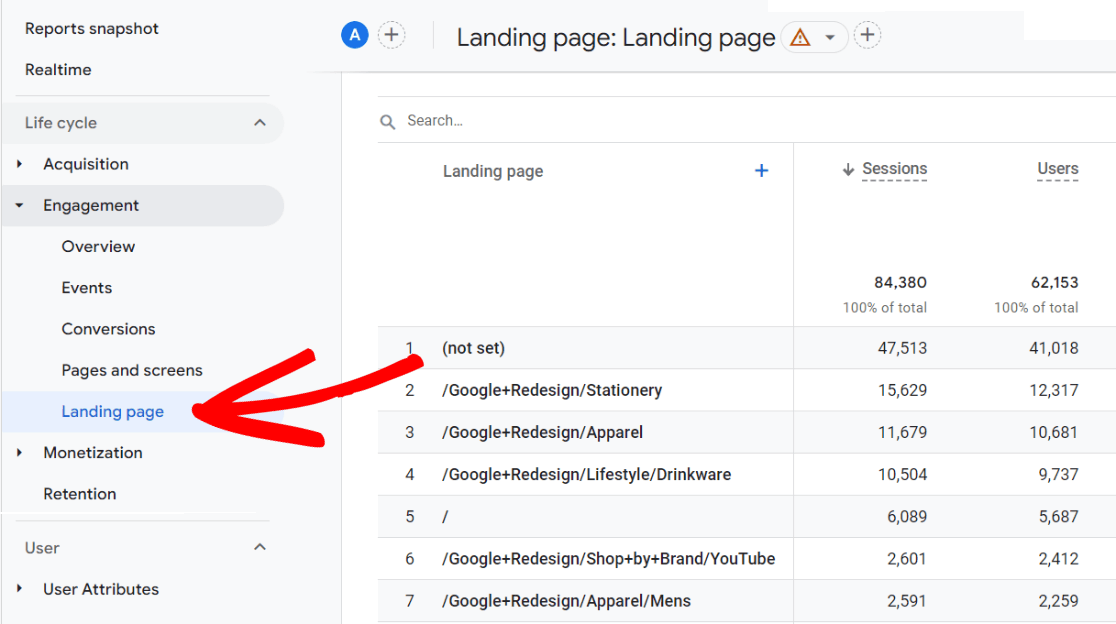
For the full tutorial on setting up this report, check out Google Analytics Landing Pages: Reporting Guide.
Google Analytics Metric #4. Demographics
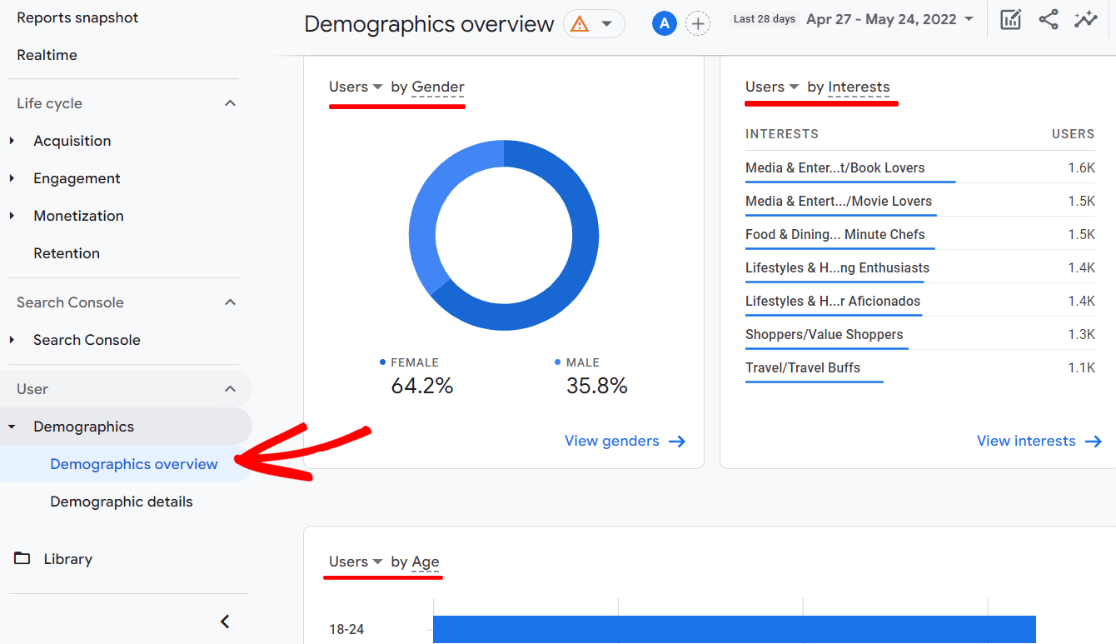
Google Analytics gives you demographic and interest reports on your visitors, like gender, age, and more. You can use that information to help tailor your message to your audience. Or, decide who to target with Google Ads and social media.
In MonsterInsights, find demographics data in the Publisher tab:

In Google Analytics, find your demographics reports, such as gender, interests, and age, under Reports » Demographics » Demographics overview:
Google Analytics Metric #5. Social Media Traffic
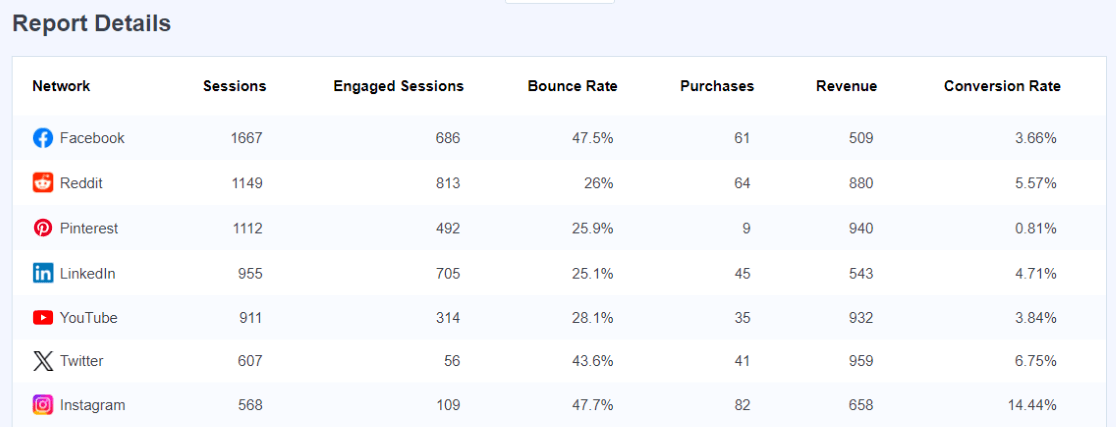
This report is incredibly helpful if you’re posting on social media sites like Facebook, TikTok, LinkedIn, Instagram, or Pinterest. Is your social media traffic engaging with your content? Are those users viewing more than one page? Are they completing any conversions? All of these data points can help you understand and improve your social traffic.
In MonsterInsights, you can see any social media referral traffic in your referral report in the Overview tab:
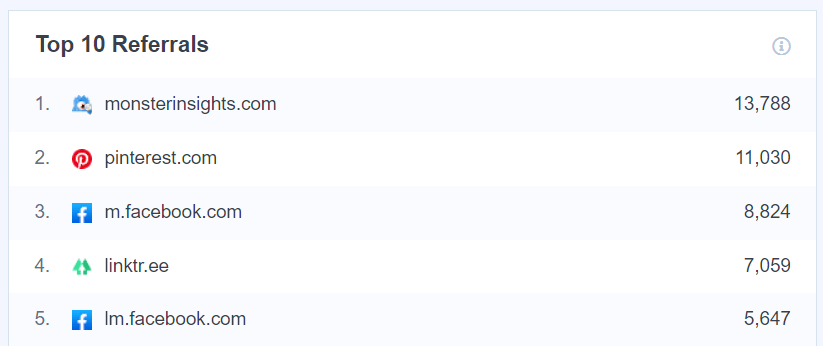
Or, head to Insights » Social to see traffic metrics from each social media channel:
In Google Analytics, you’ll need to build a custom exploration report. If you haven’t done that yet, here’s a handy guide on how to create custom reports in Google Analytics.
Follow these steps to create your social media report:
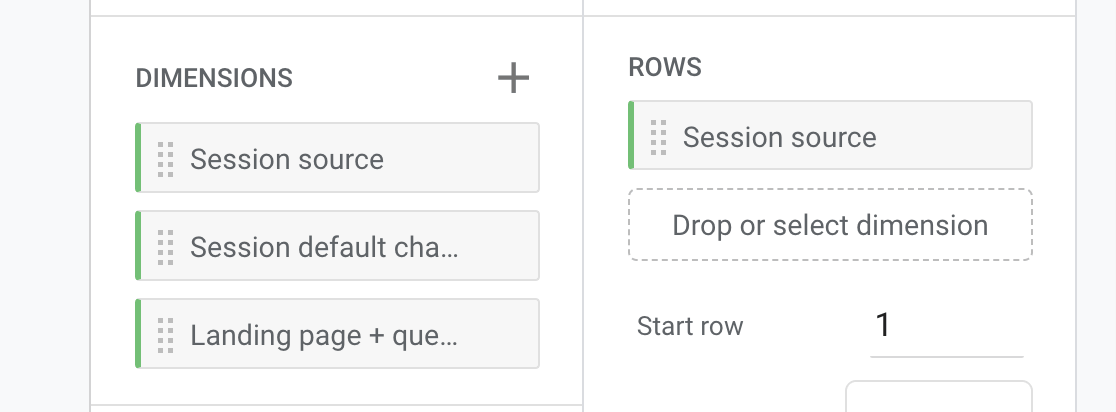
- Import the following Dimensions:
- Session source
- Session default channel grouping
- Landing page
- Click and drag Session source from your Dimensions into the Rows box.
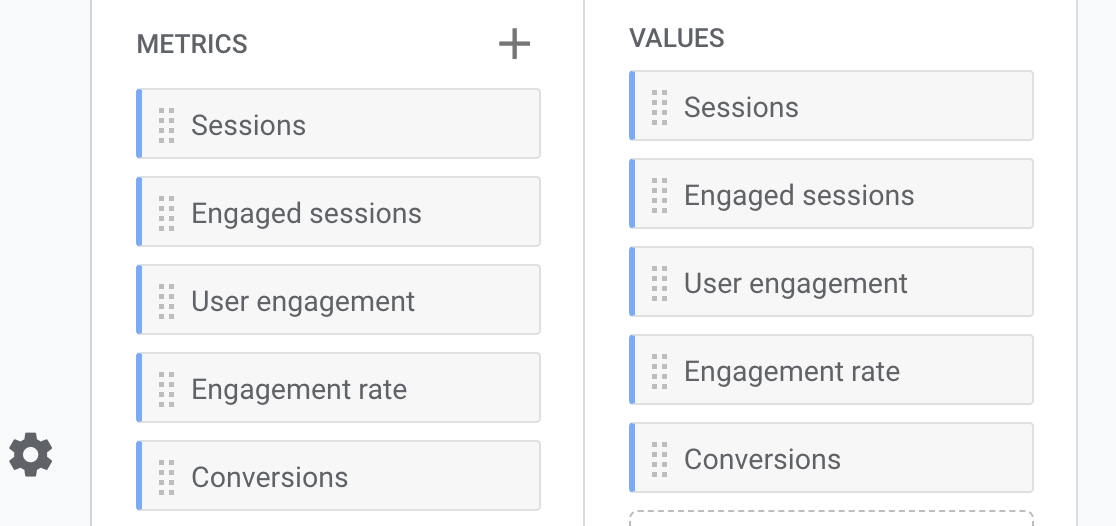
- Import the following Metrics:
- Sessions
- Engaged sessions
- User Engagement
- Engagement rate
- Conversions
- Click and drag all five Metrics into the Values box.
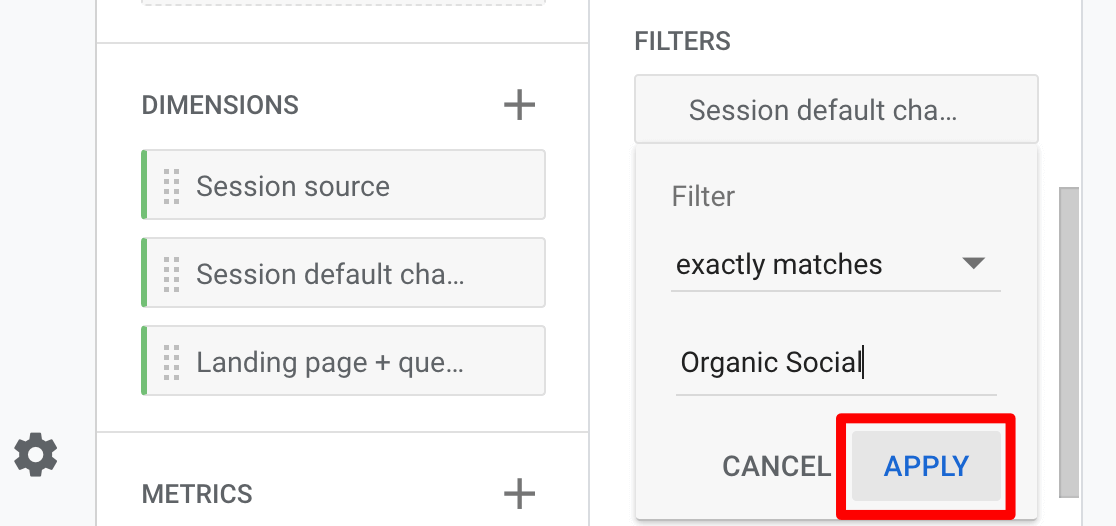
- Click and drag Session default channel grouping from your Dimensions into the Filters box. Configure your filter to exactly matches and type/choose Organic Social under the Enter expression field. Then, press Apply.
Now, you should have a social media channels report that looks like this:
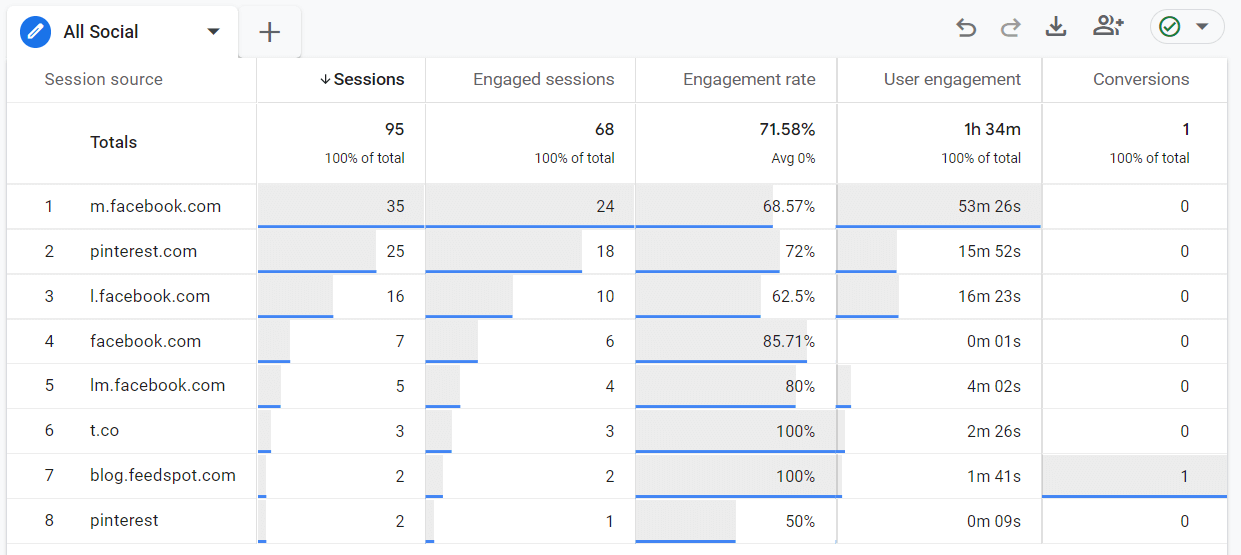
Want to view your social traffic by landing page instead of social network? Just swap out Session source for Landing page in the Rows box.

For a full walkthrough on tracking social media traffic in Google Analytics, check out How to Set up Google Analytics Social Media Tracking.
Google Analytics Metric #6. Search Console
When you connect Google Analytics with Search Console, you get a powerful report about your organic traffic that can help you become the savvy marketer you want to be. Knowing which Queries on your site rank and generate traffic can really help you zero in on your SEO efforts for certain keywords.
For instance, do you see a query for which you have a lot of impressions but not many clicks? Search that keyword in Google to find out what everyone else is doing that you may be missing on your page.
In MonsterInsights, find your report in the Search Console tab:
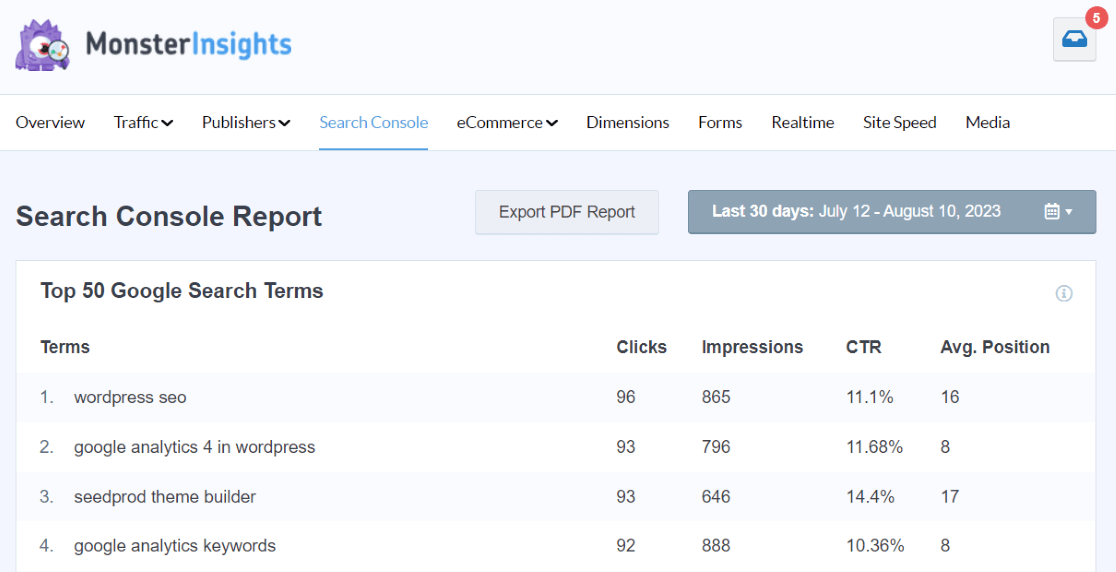
There’s no Search Console report available in Google Analytics, but you can find your query data inside Search Console.
First, you’ll need to go to Google Search Console and sign in with your account.
Then click on Search results in the left-hand menu. Here, you can see a graph of your total clicks, impressions, average click-through rate (CTR), and position.
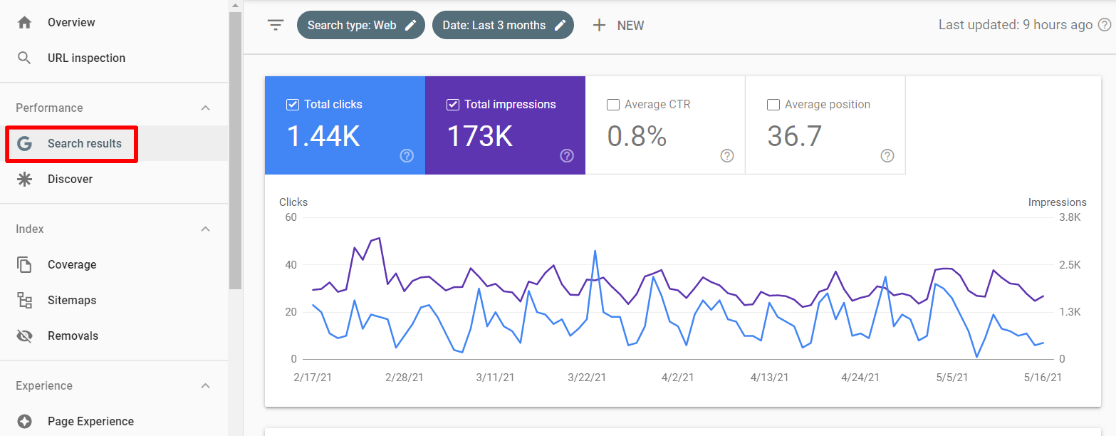
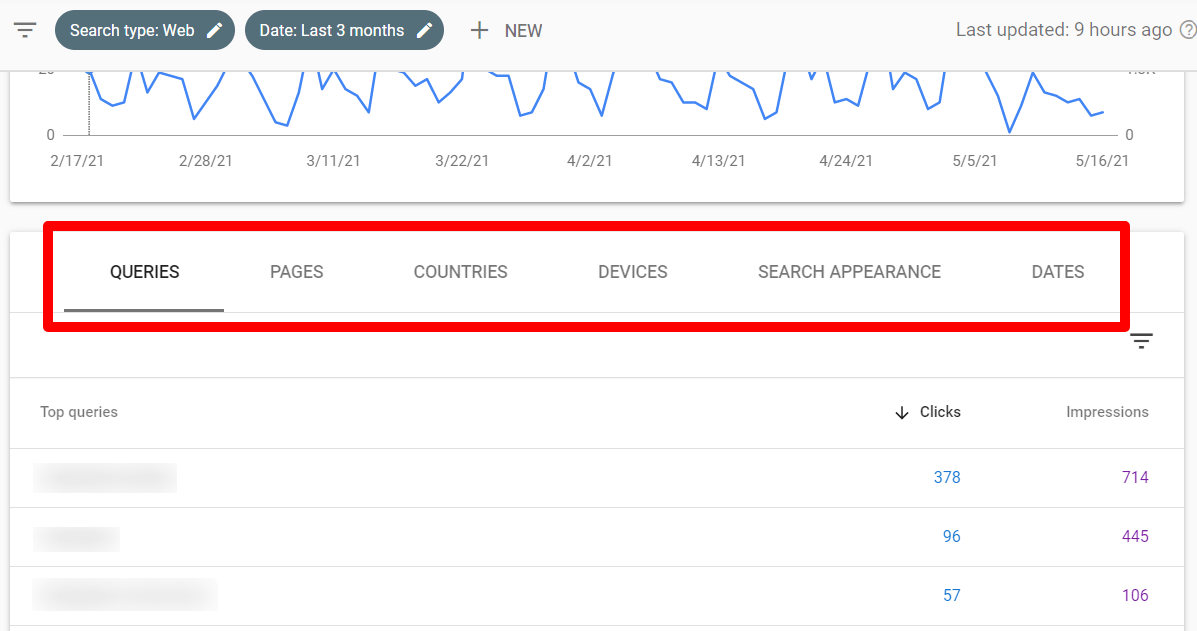
Now, scroll down to see the Queries table. It shows the top Google search keywords people use to find your website. You can also click over to Pages, Countries, Devices, Search Appearance, or Dates to see your search data in different ways.
For more on using Google Search Console, check out How to Use Google Search Console for SEO: Top 11 Hacks.
Google Analytics Metric #7. Key Events (Conversions)
What’s the goal, or goals, of your website? Is it to get prospects to contact you? Or for customers to buy a product? Or maybe it’s for users to read posts and click ads? Whatever your specific goals are, you can track them in Google Analytics.
For a tutorial on tracking key events (conversions) with MonsterInsights, check out the Complete Guide to Conversion Tracking for WordPress.
Since these are custom and vary by website, Google doesn’t come with key events (conversions) or goals already set up.
In Google Analytics, you can mark existing events as key events by clicking on the Admin cog, then Data display » Events. Locate the event in the Existing events table. Then, In the event’s Mark as key event column, click to turn the switch on.
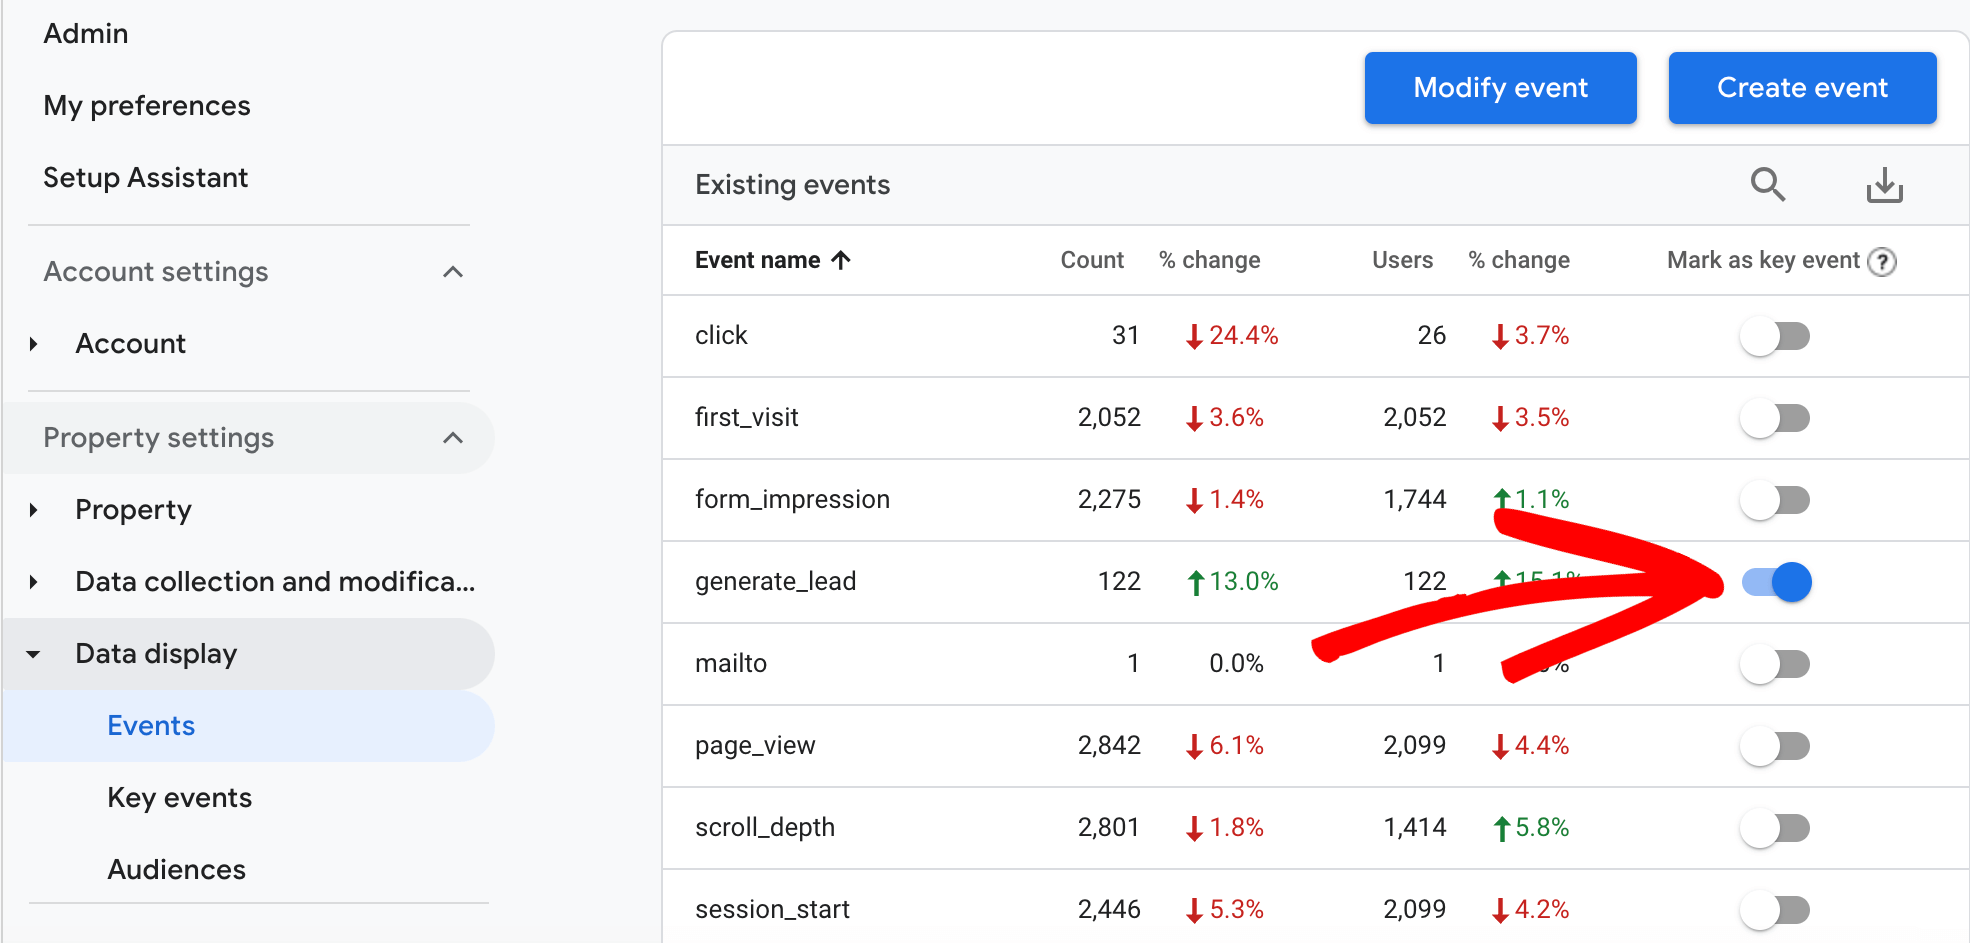
New, you’ll see key events (conversions) in many of your reports, including from your organic traffic the Traffic acquisition report under Acquisition:
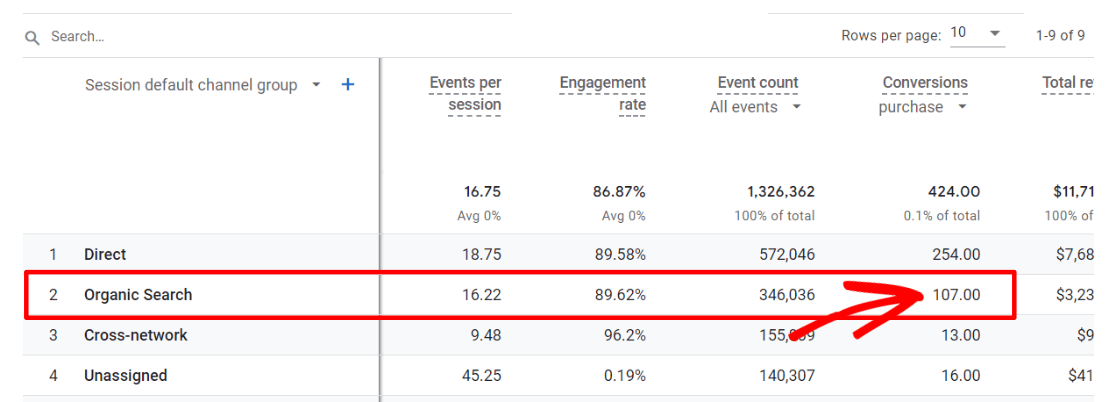
For more on setting up key events (conversions) in Google Analytics, check out this guide.
Google Analytics Metric #8. New vs. Returning Visitors
This is a simple but important engagement metric that gives you more information about your visitors. You can use this report to see if you’re attracting the right kind of visitors.
For instance, if you sell products, you probably want a mix of new and returning visitors. If you check this report and see that your visitors are mostly new, that’s a big clue that you need to do more to bring previous customers back in for another purchase.
In MonsterInsights, this report is located in your Overview tab next to your device breakdown:

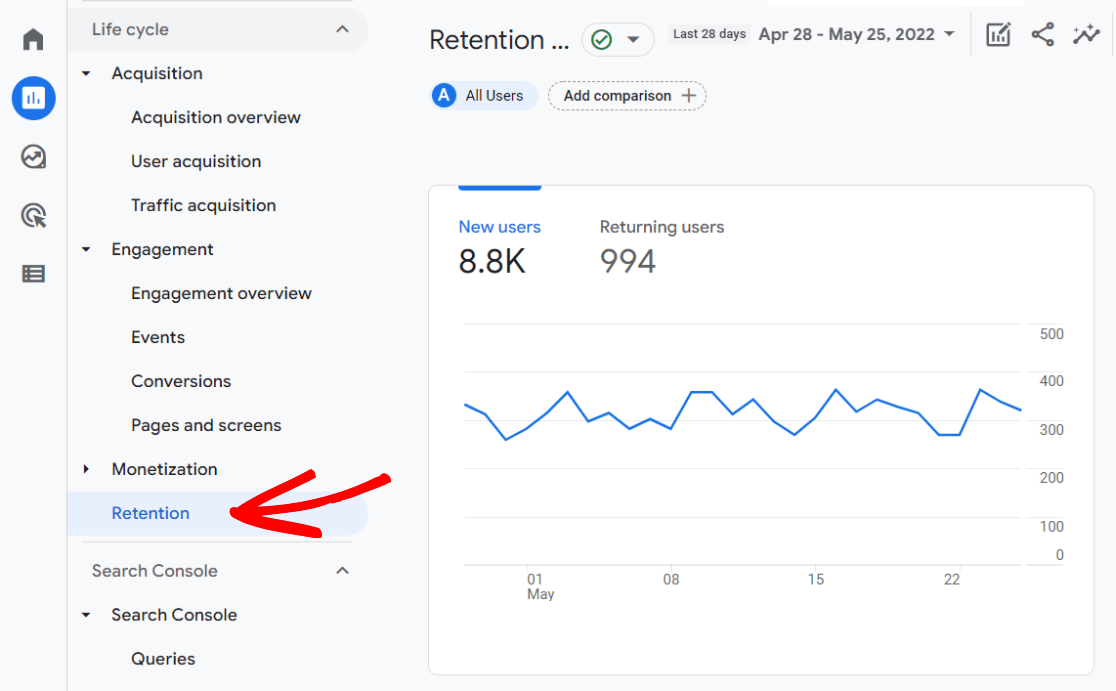
In Google Analytics, find New Users and Returning users in the Retention report:
Google Analytics Metric #9. Engagement
Engagement is one of the most important Google Analytics metrics. It indicates whether users find what they’re looking for on your site and engage with your content.
You can find several user engagement metrics in Google Analytics, but we’ll focus on overall average engagement time and engagement time per page.
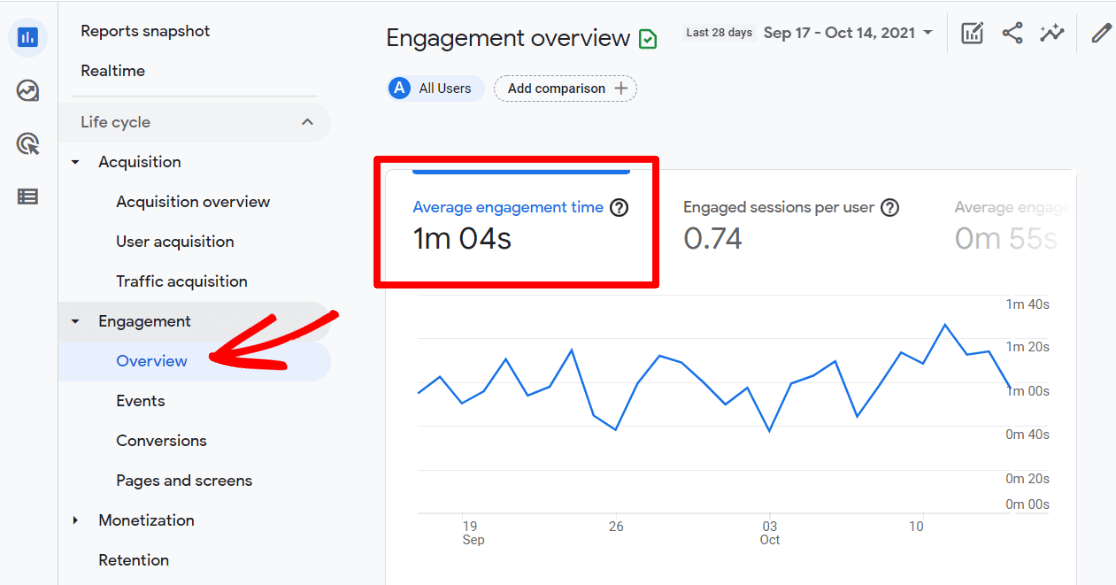
The Average Engagement Time for your site shows you how long, on average, users are spending on your site. In Google Analytics, you can find this metric under Engagement » Overview.
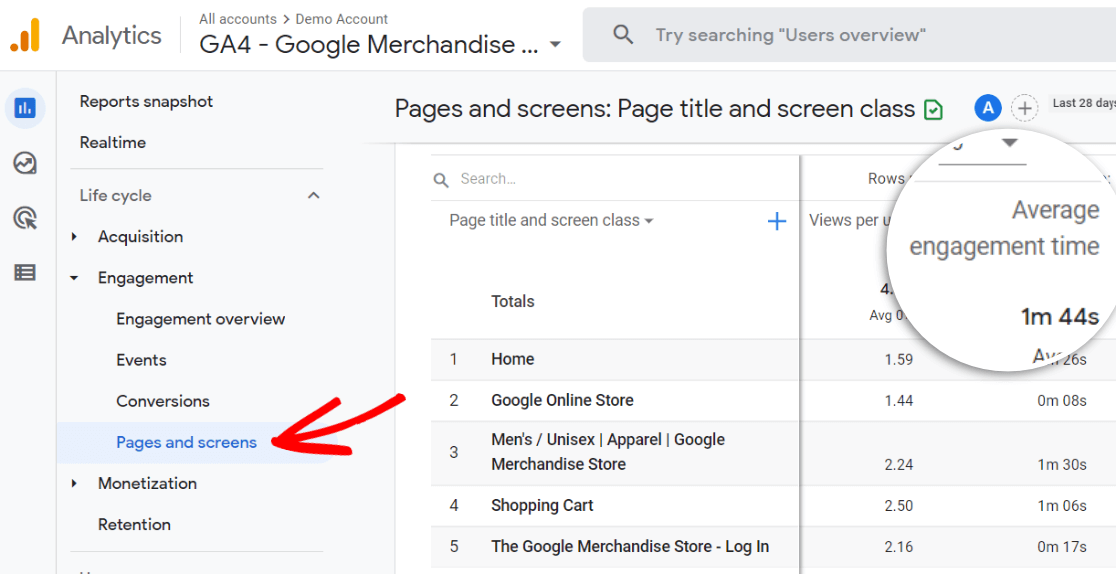
To find your average engagement time per page, navigate to Engagement » Pages and screens, then scroll to the table. Depending on your screen size, you might have to scroll the table to the right a little bit to find the Average engagement time column.
Want to improve your engagement metrics? Check out 8 Proven Ways to Increase User Engagement on Your Website.
Google Analytics Metric #10. Pageviews
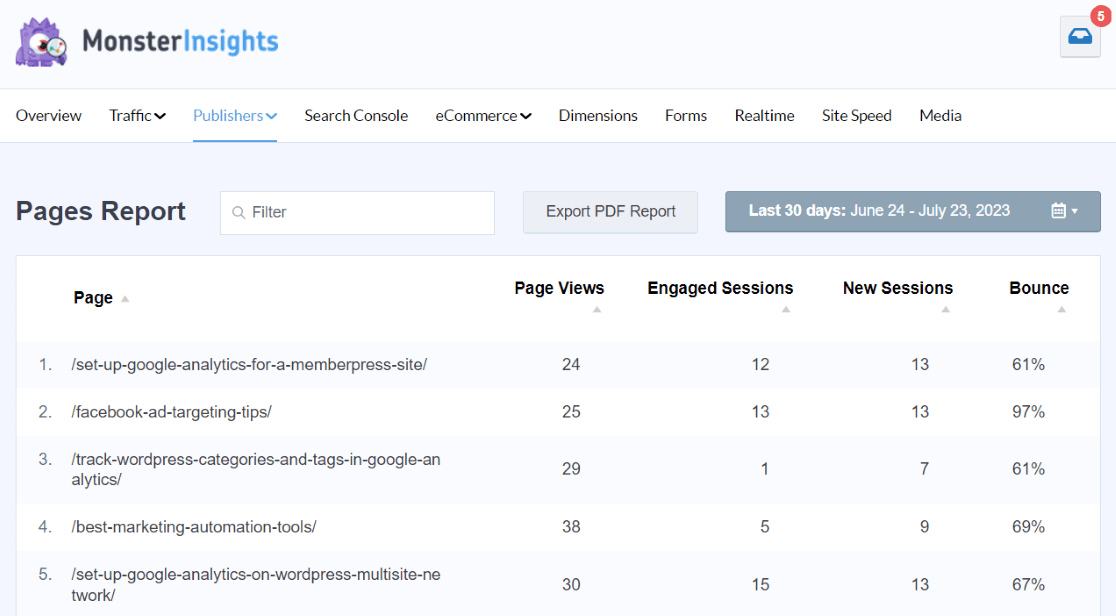
Similar to the Landing Pages report, this report shows a listing of your pages and how many views they got, plus other engagement metrics. However, while Landing Pages shows which pages people landed on when they came to your site, the Pages report shows all pageviews.
So, no matter how a person gets to your site, what are the top pages that person might visit next? What content are visitors finding once they get to your site?
In MonsterInsights, find this report under Insights » Publishers » Pages:
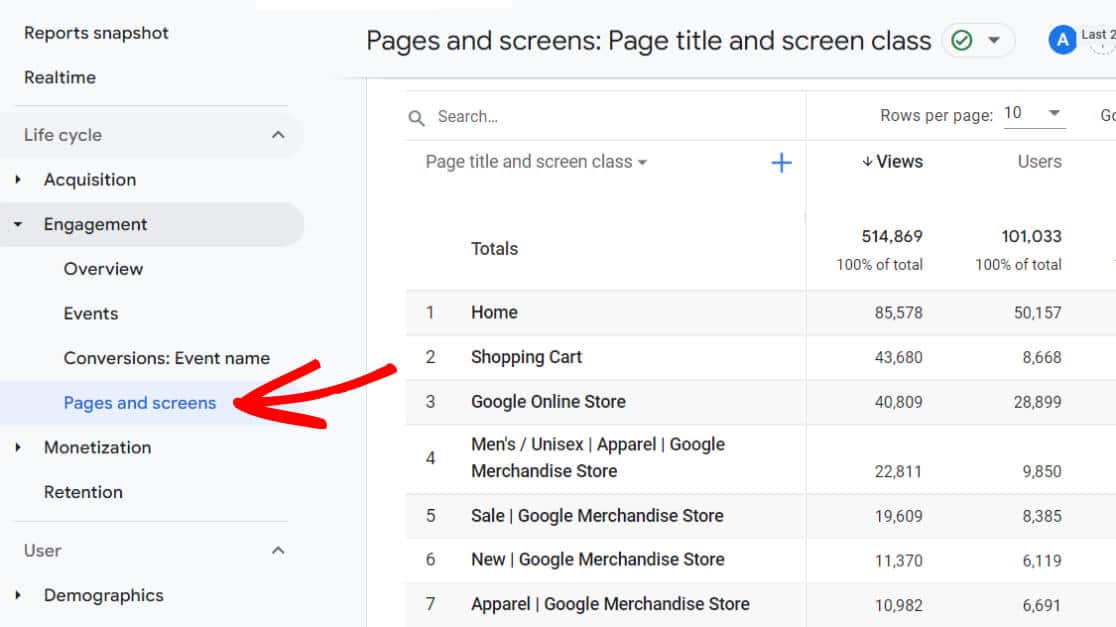
In Google Analytics, find the pages report under Engagement » Pages and screens. Scroll down to find the table where all the pages that your users visited in the timeframe you have selected are listed.
Google Analytics Metric #11. Mobile Devices
This report shows you which mobile devices were used to access your site. In a world where so much of all website traffic is via mobile, it’s important to make sure your website works and looks great on all devices.
With this report, you can see if there might be a problem with a certain device. Does one device type have a very low average time on the page? You might need to do some testing for that type of device.
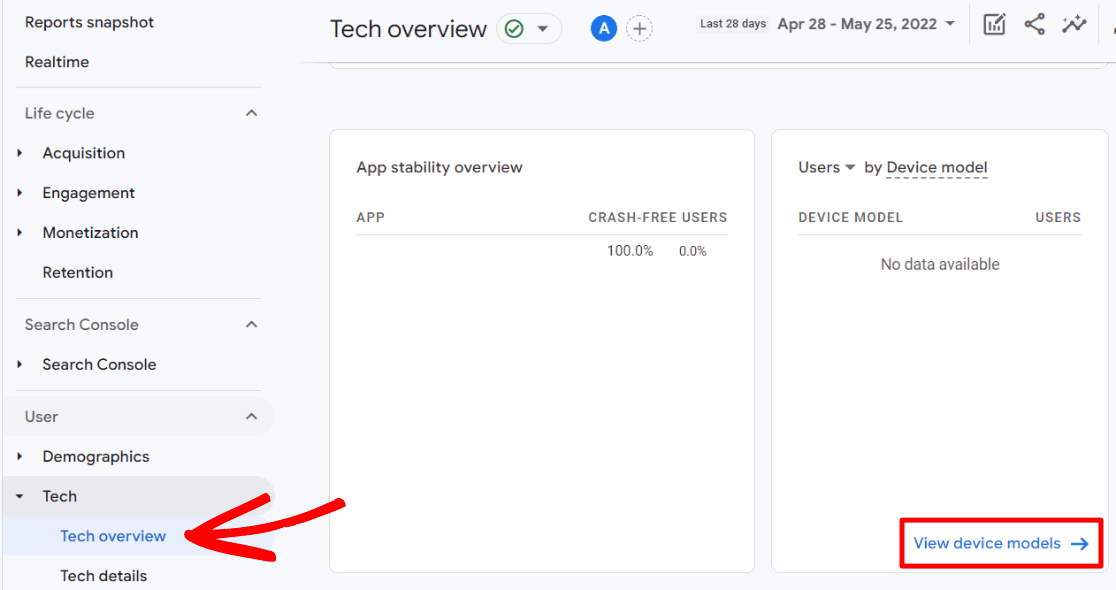
In Google Analytics, find mobile devices under Reports » Tech » Tech overview. Scroll all the way to the bottom to find the Users by Device model card. Click the link at the bottom to view the full report.
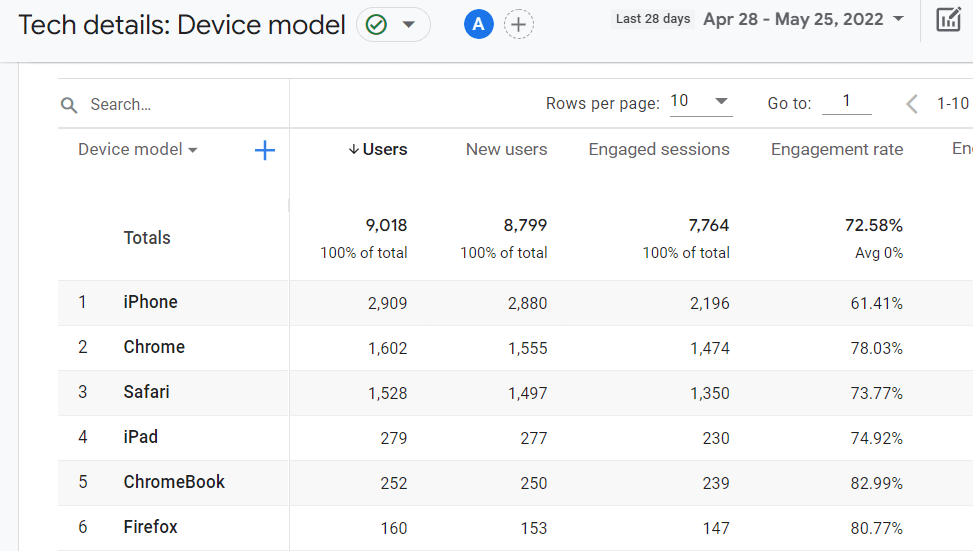
In the table on the next page, you’ll find information for each device model that visited your site (note that some devices are lumped by which browser was used):
There you have it: 11 Google Analytics metrics that’ll help you grow your business.
Not using MonsterInsights yet? What are you waiting for?
If you liked this article, you might also want to read:
9 Top eCommerce Metrics & KPIs to Track in Google Analytics 4
16 Content Marketing Metrics That Matter the Most
5 SEO Analytics and Reporting Tips to Boost Organic Traffic
10 Best Ways to Measure SEO Performance in Google Analytics
11 Best PPC Metrics & KPIs to Track
Finally, don’t forget to follow us on YouTube for more helpful reviews, tutorials, and Google Analytics tips.
FAQ
What are the most important metrics in Google Analytics?
Google Analytics offers many metrics that provide insights into various aspects of your website traffic and user behavior. Some of the most important metrics to track include:
- Overall Traffic and Traffic Sources: Understand where your visitors are coming from, whether it’s direct visits, search engines, or referrals from other sites.
- Audience Location: Discover the geographical locations of your visitors to better target your content or ads.
- Landing Pages: Identify which pages are the first point of contact for your visitors and what content is drawing them in.
- Demographics: Learn about the age, gender, and interests of your audience to tailor your marketing efforts.
- Social Media Traffic: Measure the impact of your social media efforts by tracking traffic from different platforms.
- Search Console Queries: Analyze which search queries are bringing visitors to your site to refine your SEO strategy.
- Key Events (Conversions): Track specific actions that are crucial to your business goals, such as purchases or sign-ups.
- New vs. Returning Visitors: Determine the proportion of first-time versus repeat visitors to assess loyalty and visitor retention.
- Engagement: Measure how users interact with your site, focusing on metrics like average engagement time and engagement time per page.
- Pageviews: Track how many times each page on your site is viewed, regardless of the entry point.
- Mobile Devices: Monitor which mobile devices visitors use to access your site to ensure optimal performance and design.
What can Google Analytics tell you about your website?
Google Analytics provides a comprehensive overview of your website’s performance, helping you to understand user engagement, traffic sources, and more. It can reveal:
- How many people visit your site and how they find it.
- Which pages are most popular and which need improvement.
- User demographics, such as age, gender, and location.
- The effectiveness of your marketing efforts across different channels.
- How well your website converts visitors into customers.
How do I analyze Google Analytics metrics?
To effectively analyze Google Analytics metrics, follow these steps:
- Set Clear Goals: Define what success looks like for your website—be it increased traffic, higher conversion rates, or improved user engagement.
- Use Dashboards: Leverage dashboards in Google Analytics or MonsterInsights to view key metrics at a glance.
- Compare Data Periods: Regularly compare data across different time periods to spot trends and detect anomalies.
- Utilize Custom Reports: Create custom reports to focus on specific metrics that align with your business objectives.
- Continual Optimization: Use the insights gained to make data-driven decisions for optimizing your website and marketing strategies.
What is the difference between sessions and pageviews in Google Analytics?
Sessions refer to the total number of visits to your site, including all interactions (such as pageviews, events, etc.) within a single visit. Pageviews measure how often a page on your site is viewed, regardless of whether it is the same user viewing the page multiple times.
Understanding the difference between these metrics helps you analyze user interaction patterns and site engagement.

Thanks for this guys
Hi – I don’t see a Demographics section in my Reports – I only see Acquisition, Engagement, Monetization and Retention. Under User, I do have User Attributes and under User Attributes there is Demographic details. But it’s not giving me all the same information that you are showing above.
How/why am I missing Demographics? And how do I get it to appear? Thanks in advance.
Hi Scott – Thanks for your question! This is definitely information we should add to the article, so thank you for pointing that out. To enable further demographics reporting in GA4, you need to enable Google Signals. Find instructions for that here: https://www.monsterinsights.com/how-to-see-the-demographics-of-your-website-users/#step3