Wondering how to create custom reports in Google Analytics 4 (GA4) using the new Explore tab?
The custom report builder in GA4 looks complicated at first, but with a little practice, you’ll be able to set up custom exploration reports in no time.
You’ll only learn how to create custom reports in GA4 by trying them and playing around with the settings. There’s just no way around that. So, follow our tutorial first, then challenge yourself to create a couple of reports!
In this article, we’ll go over step-by-step instructions on creating a basic, free form custom report.
If you’re looking for instructions on funnel reports, check out GA4 Funnel Exploration Reports: Beginner’s Guide.
If you want to learn about the path exploration report, check out How To Use the Google Analytics 4 Behavior Flow Report.
Video Tutorial
GA4 Explorations: Variables vs. Tab Settings
Before diving into our step-by-step tutorial, we need to explain how GA4’s reporting interface is laid out.
When you first set up a report, you’ll notice that there are two columns in the report editor: Variables and Tab Settings. This can be a little overwhelming, so plan to focus on one at a time.
Variables
In this column, you choose all the variables you might want to use in your report. You want to think about all the data you might want to see (like channels, pages, conversions, events. etc.) and add it here. These do not appear in the report without being dragged to the other column.
Think of variables like all the data you might like to play around with in your report.
Tab Settings
This column is what actually controls what appears in your report. You’ll drag and drop dimensions and metrics from the Variables column here to add them to your report.
Tips for Adding Variables
When adding segments, dimensions, or metrics to your report, you’ll see a long list of available variables organized under headings:
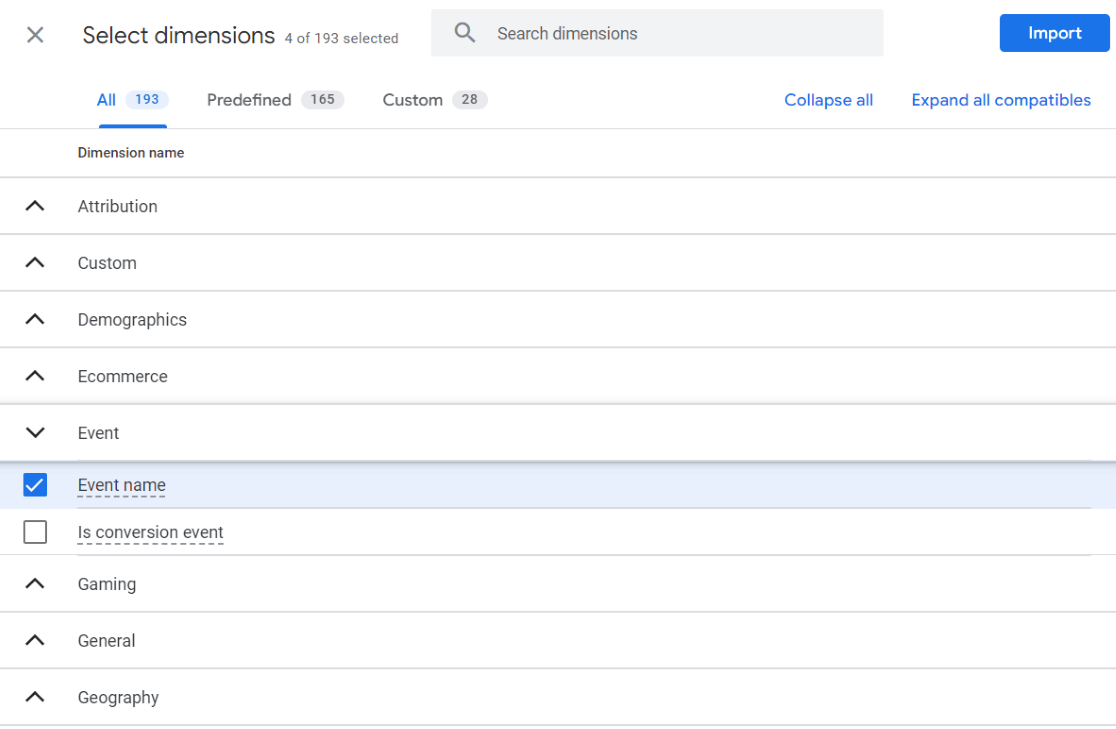
The easiest way to find what you’re looking for is to use the search bar at the top. It’s also good to familiarize yourself with all the available dimensions and metrics by browsing through them.
When you’ve chosen the variables you want to add, click the blue Import button to add them to your report.
Google Analytics 4 [GA4] Custom Exploration Reports Tutorial
Ready to create your first custom report in GA4? Follow these steps to learn the basics.
- Choose Free Form in the Explore Tab
- Pick Date Range
- Add Segments (Optional)
- Add Dimensions
- Add Metrics
- Drag & Drop Segments
- Drag & Drop Rows and Columns
- Drag & Drop Values
- Drag & Drop Filters
1. Choose Free Form in the Explore Tab
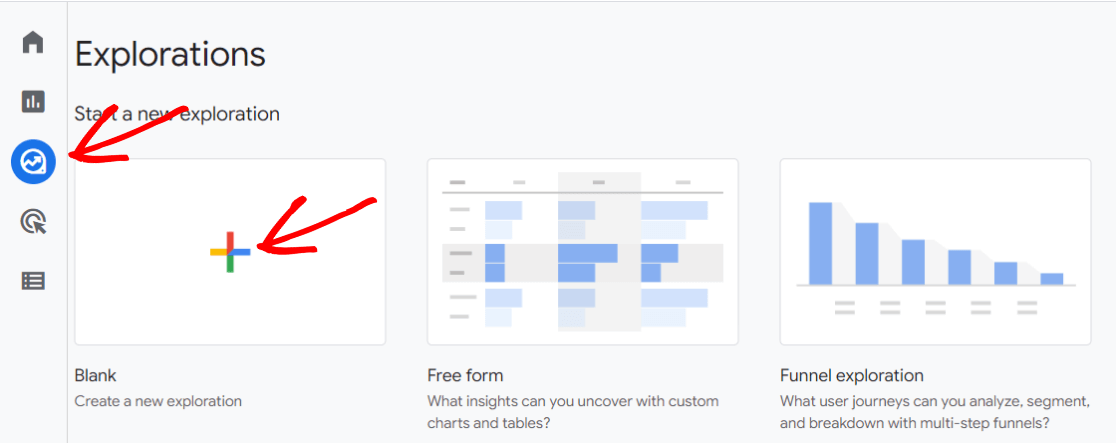
First, go to the Explore tab in the left-hand navigation bar that pops out. Then, select Free form.
You can also use a blank template to create a free form report, but we like the free form option because it populates the report with some data to start. It’s easier to experiment with it when you have the examples there, instead of starting from scratch, especially when you’re first starting out.

2. Pick a Date Range
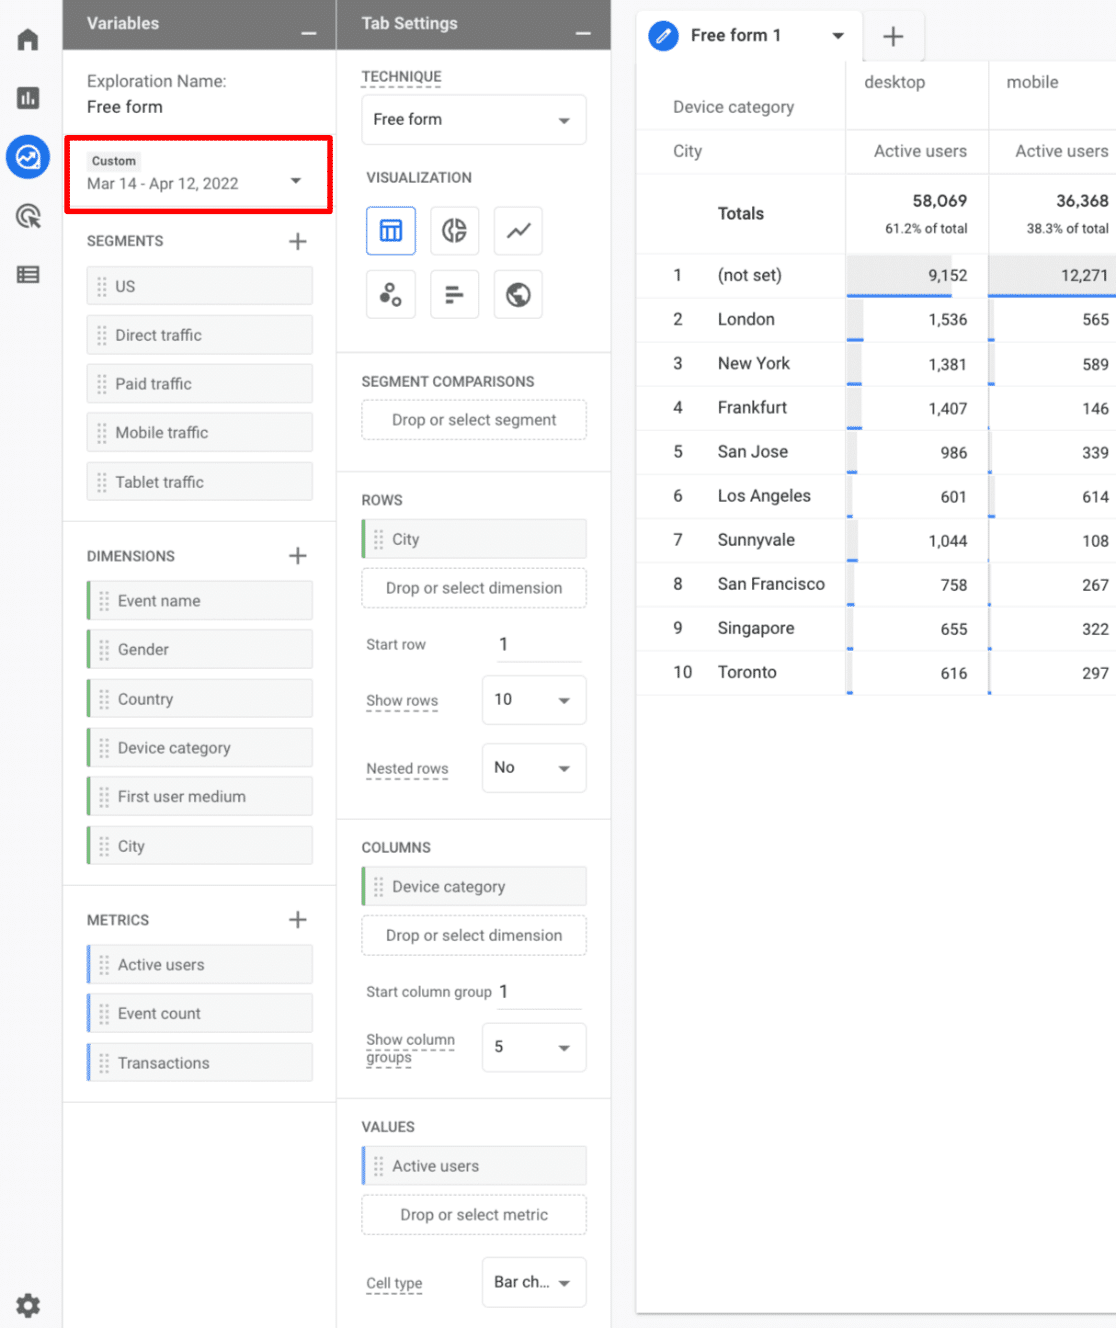
Choose a date range for your report. It defaults to the past 30 days.
3. Add Segments (Optional)
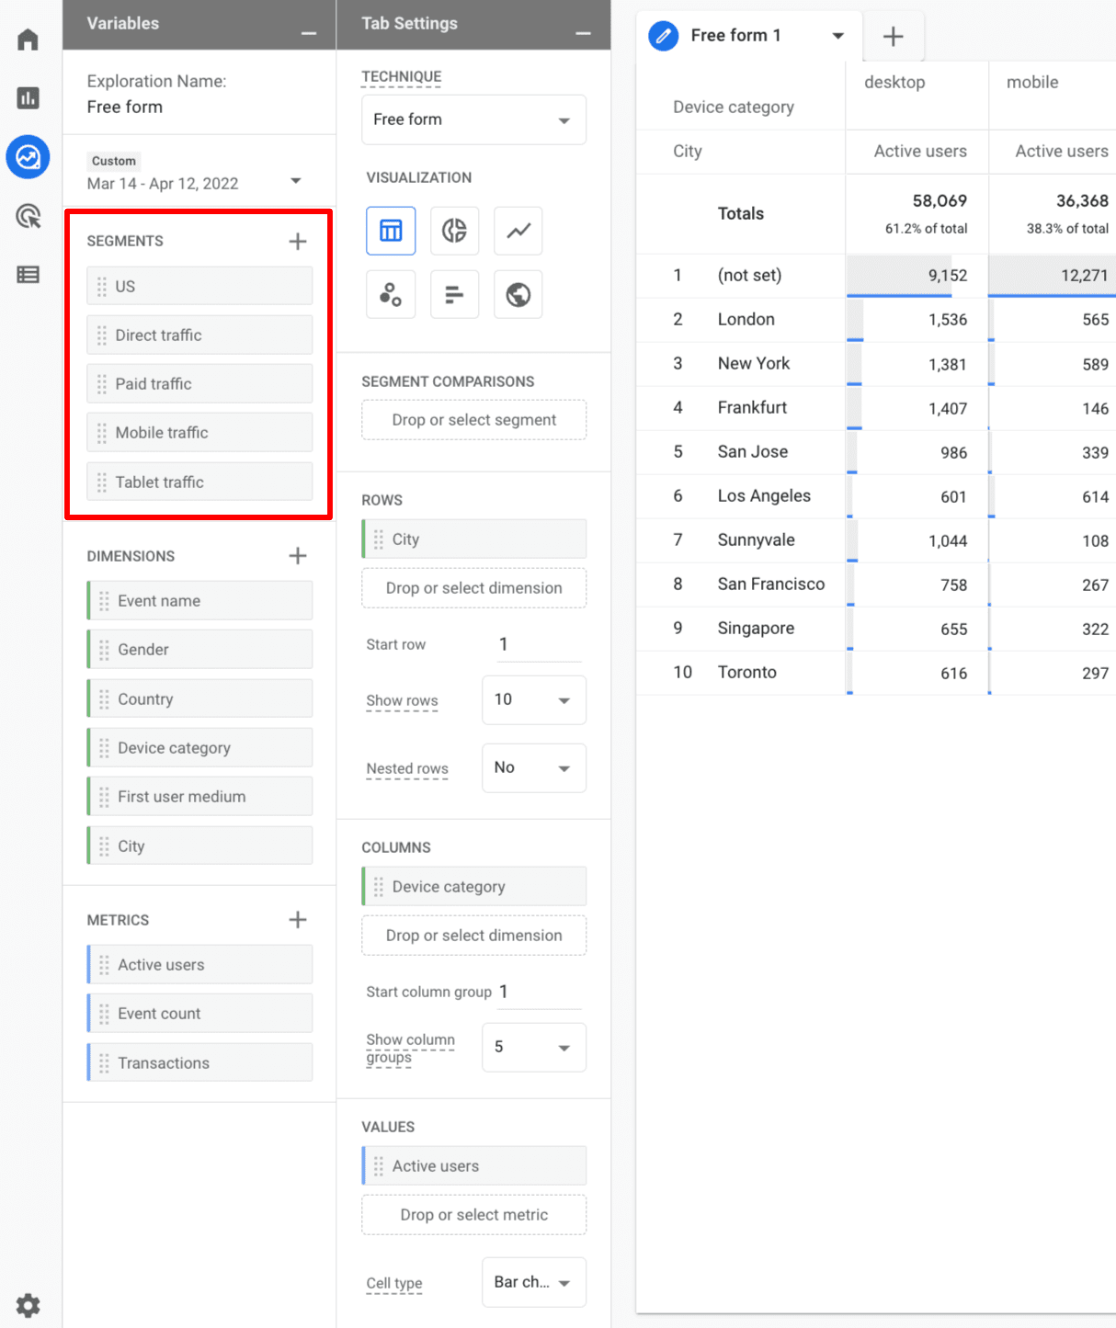
Segments in GA4 are ways of putting your traffic into buckets so you can see it alone or compare it with another segment.
Examples:
- Traffic from a certain country, region, or city
- Mobile traffic or desktop traffic
- Users who made a purchase
- Traffic from a certain channel (paid, organic, social)
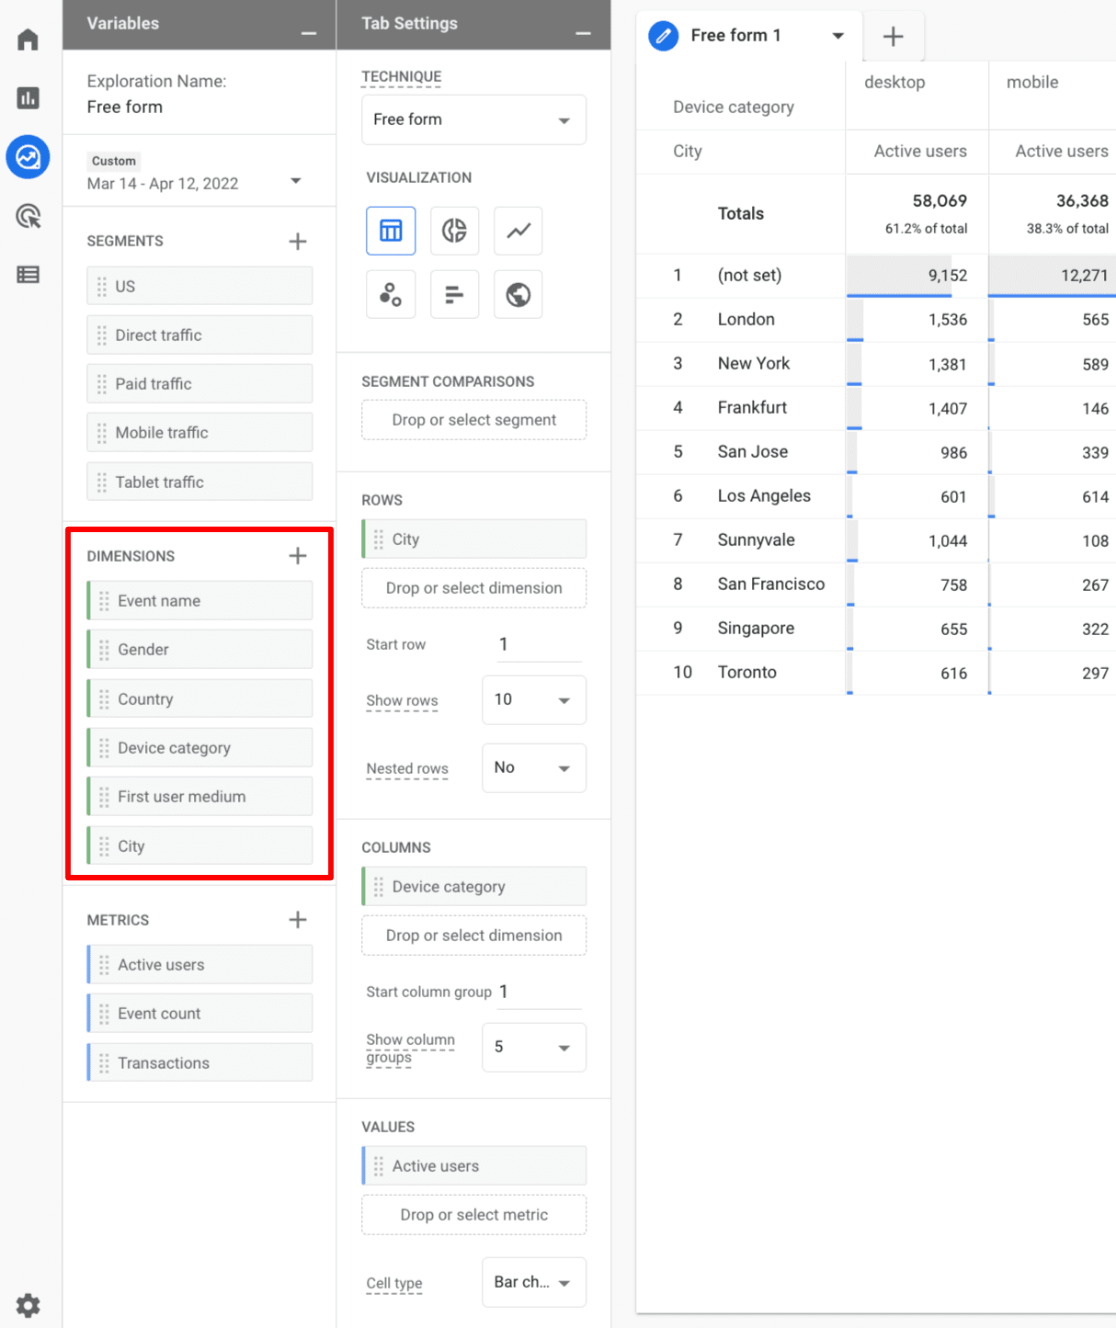
4. Add Dimensions
Add any dimensions you might want in your report beyond the ones that are there. Depending on the kind of report you want to see, you might want Event name, Campaign, or Page location.
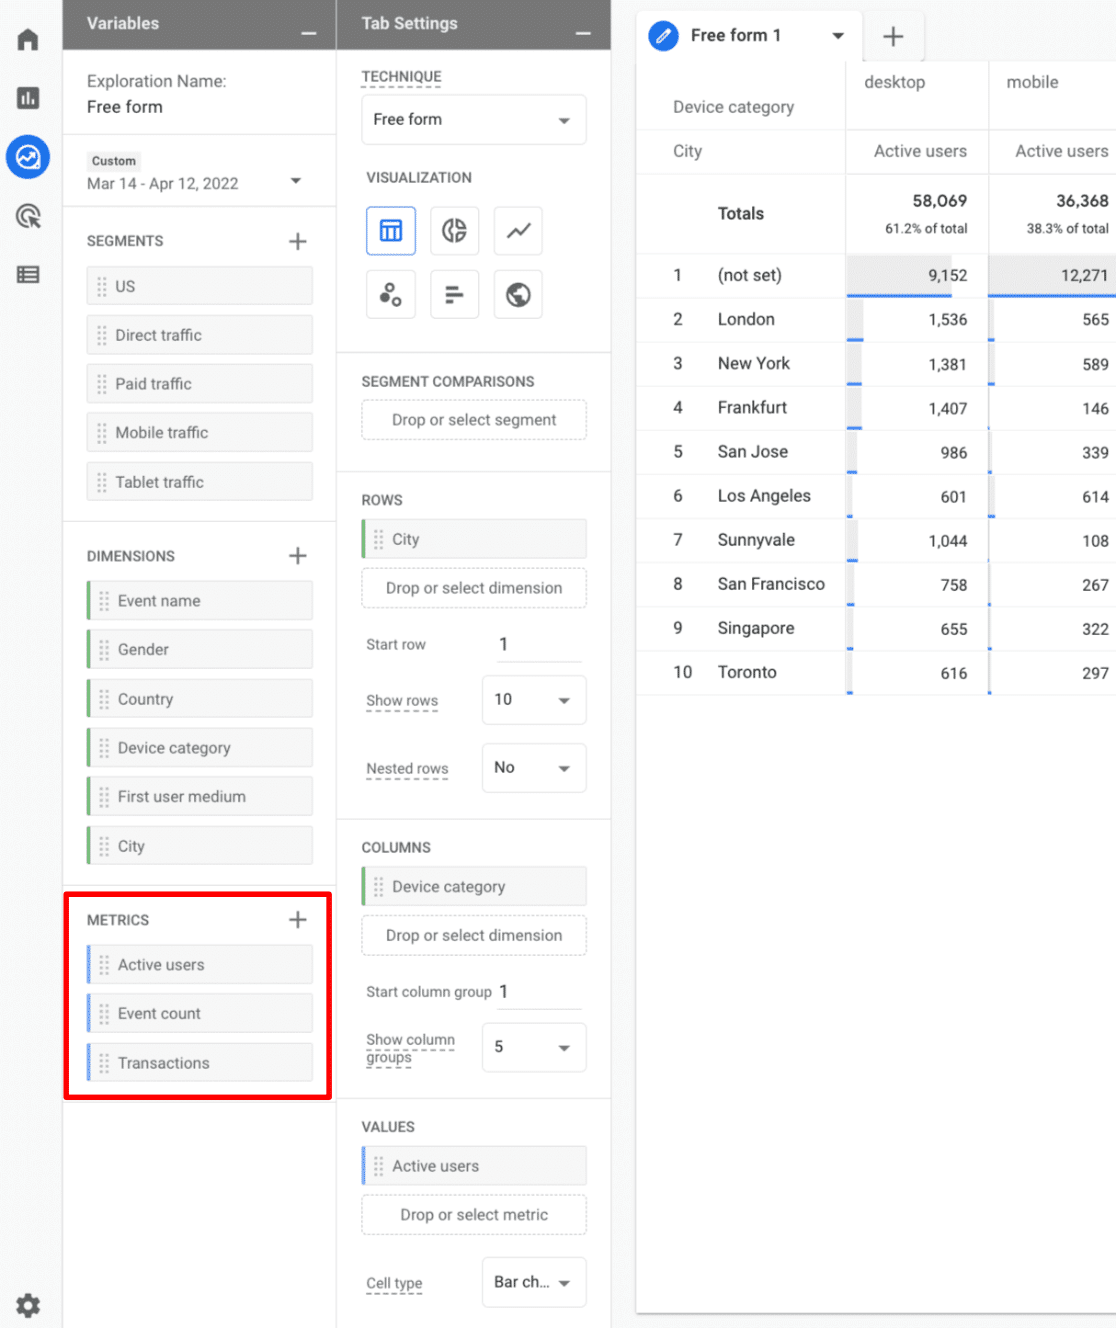
5. Add Metrics
What numbers do you want to see about the dimensions you picked? For instance, you might want to see users, views, or purchases.
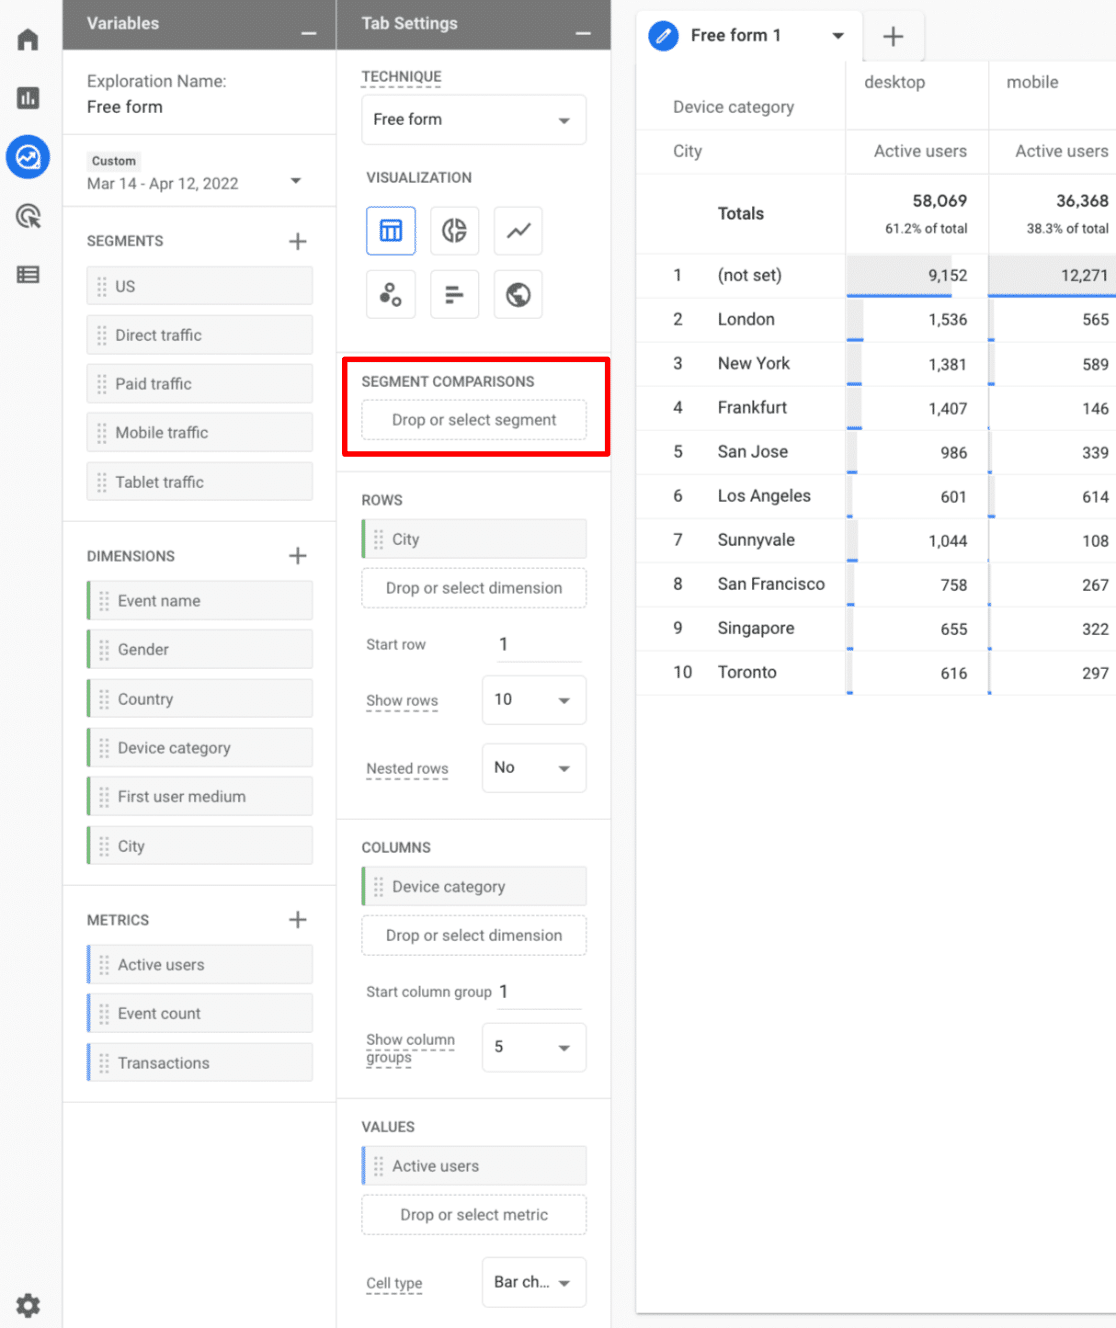
6. Drag & Drop Segments
Now that we’ve selected variables for our report, we can drag and drop them to where we want them to go. If you created any segments, go ahead and drag those over to the Segment Comparisons box.
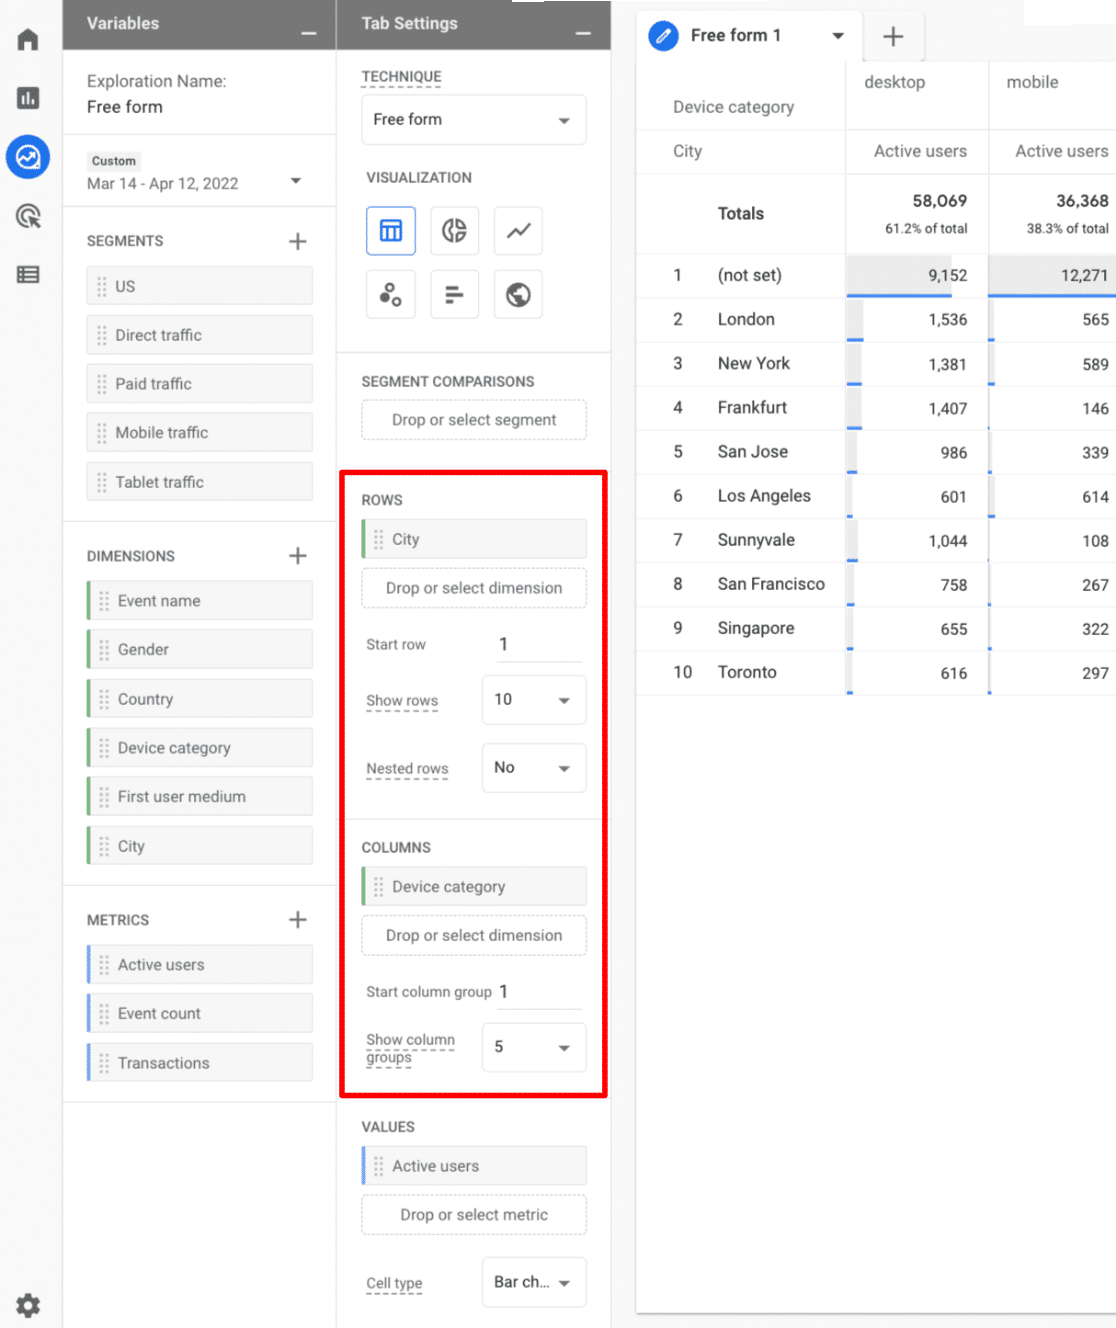
7. Drag & Drop Rows and Columns
In GA4, you can add dimensions to either rows or columns to create the in-depth report you need to understand your data.
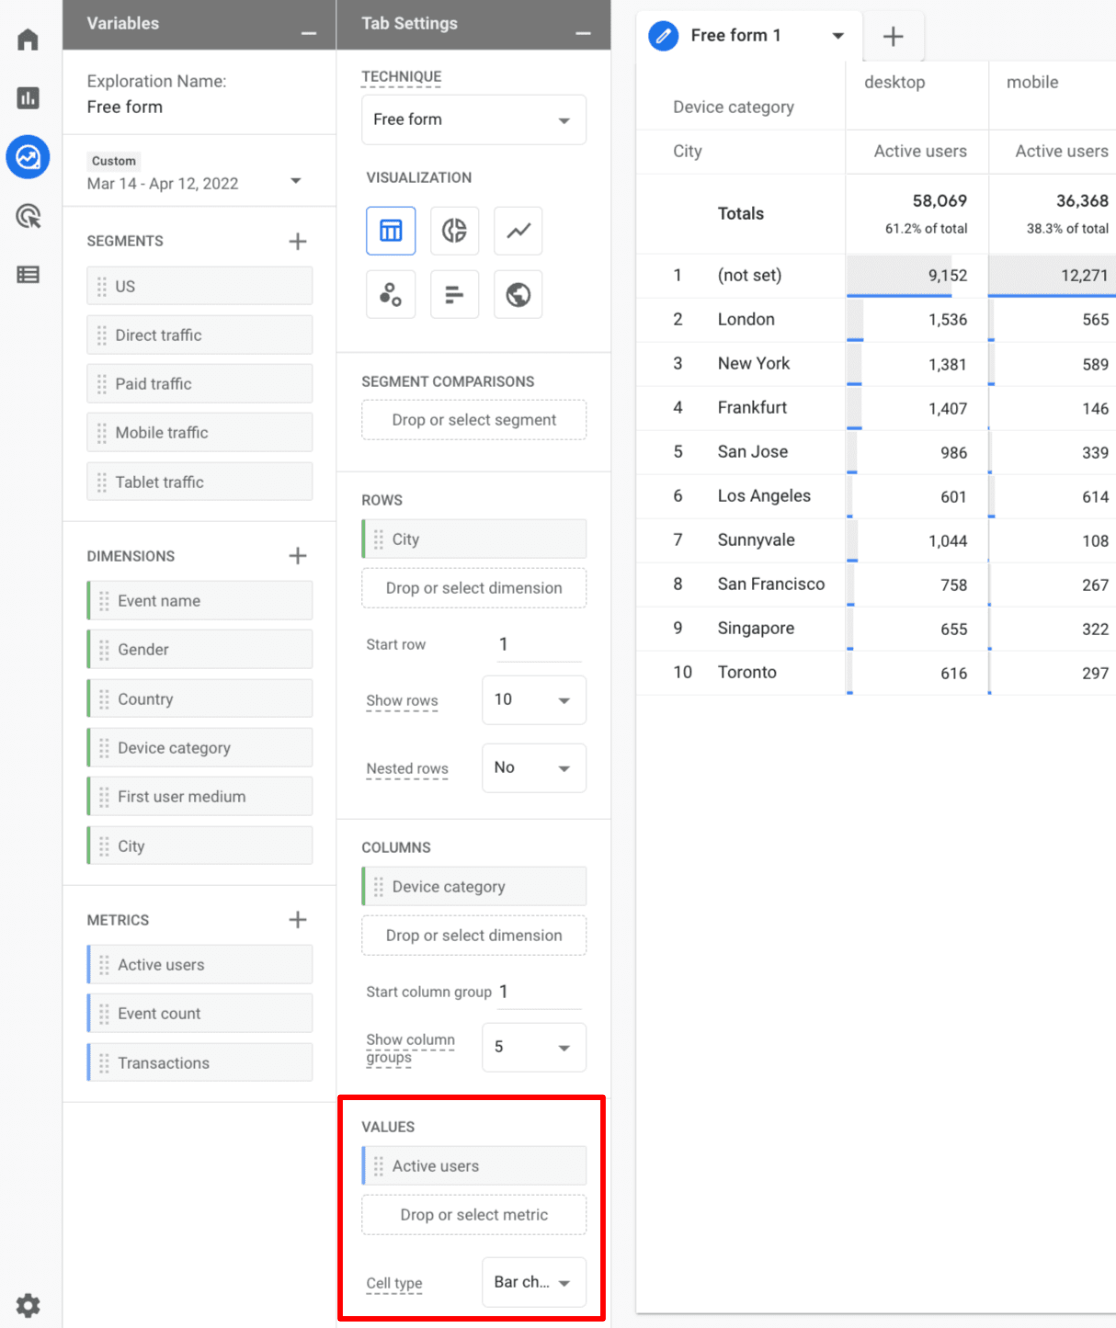
For instance, in the example report Google has made, you can see they’ve added City as a column, then Device category into rows. So, the graph will now show the city and device category for each metric (a.k.a. Value) that’s added to the report (Active users in the example graph).
If you’re new to GA4 Explore reports, we recommend sticking with adding dimensions to rows only at first, then starting to play with columns when you feel more confident.
8. Drag & Drop Values
In GA4, the section where you drag metrics is called Values. You can only drag and drop metrics into this section. “Values” is actually a pretty helpful term, since values mean numbers.
So, in Google’s example report, Active users is the value.
9. Drag & Drop Filters
If you need to filter the data in your report, the Filters box underneath Values is where you can add your filters. You can drag and drop dimensions or metrics into your filters, depending on what you’re trying to set up.
For instance, if you’re setting up an event report but you just want to see one certain event, you can drag Event name into your filters box and indicate which event you want to see.
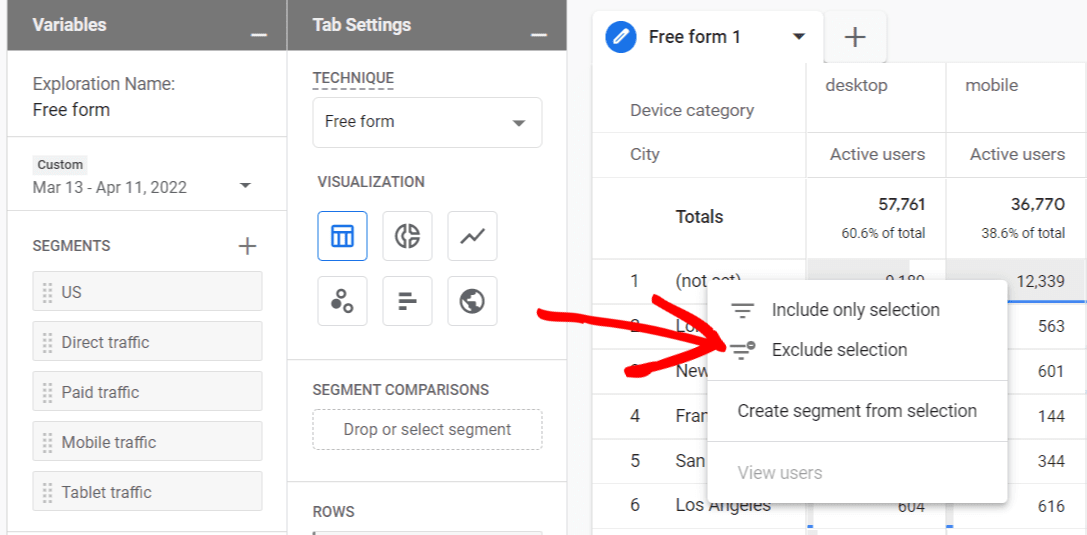
One of the coolest features of GA4 Exploration reports is the ability to filter right from the report graph. Just right-click on an item and click Exclude selection. In this example, we’re filtering out (not set):
That’s the general overview of each report section! Go ahead and play around with creating custom reports on whatever makes the most sense for your website.
Custom Explore Report Example: Landing Pages
Now, we’ll show you how to set up an example custom report using landing pages.
Step 1: Create a Free Form Report
Start with a blank report:
Step 2: Add Dimensions
Click the plus button in the Dimensions box:
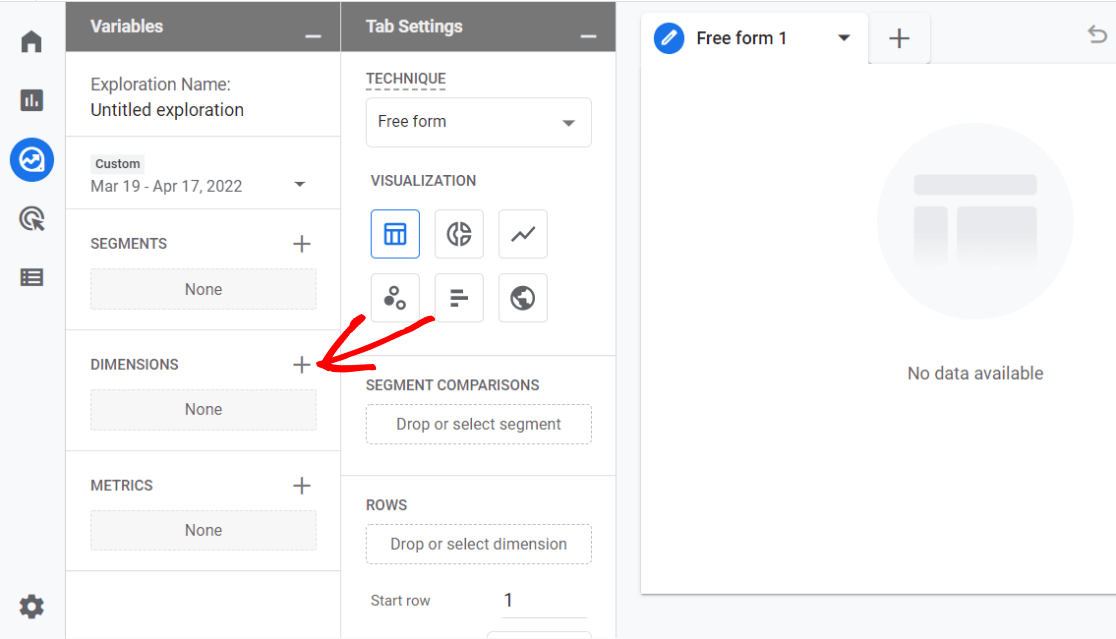
Now, use the search bar to locate and check the Landing page dimension, then click the blue Import button.

Step 3: Add Metrics
Now, click the plus button in the Metrics box:
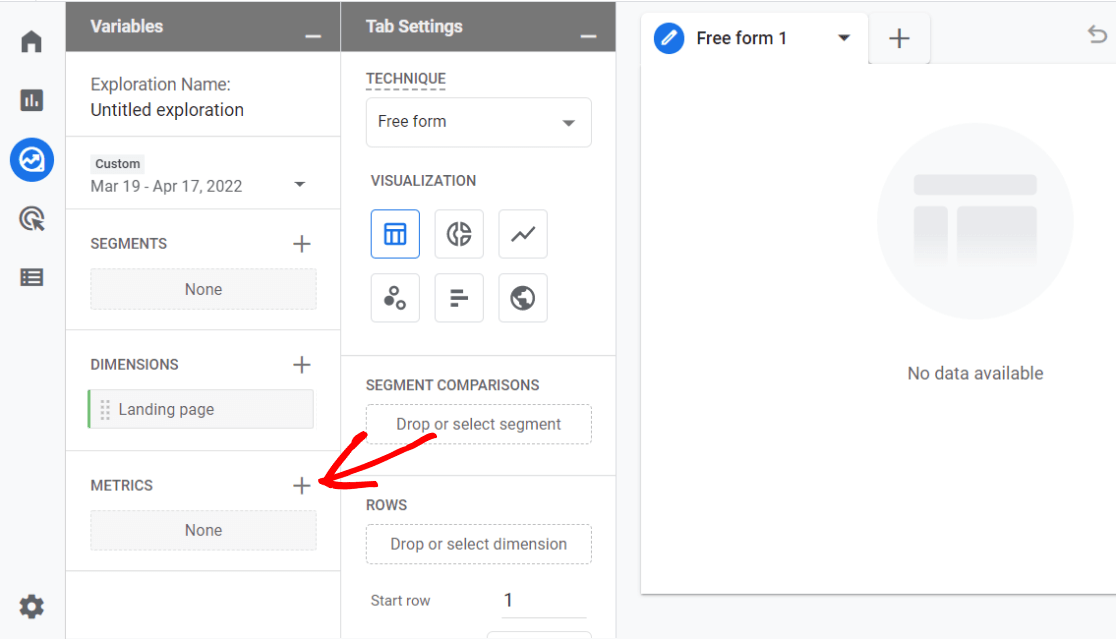
Once again, use the search bar to locate and check the following metrics:
- Entrances
- Engaged Sessions
- Engagement Rate
- New Users
- User Engagement
- Purchases (Optional)
Click the blue Import button.
Step 4: Click and Drag Dimension & Metrics
Now that your dimensions and metrics are selected, you can click and drag them into the report.
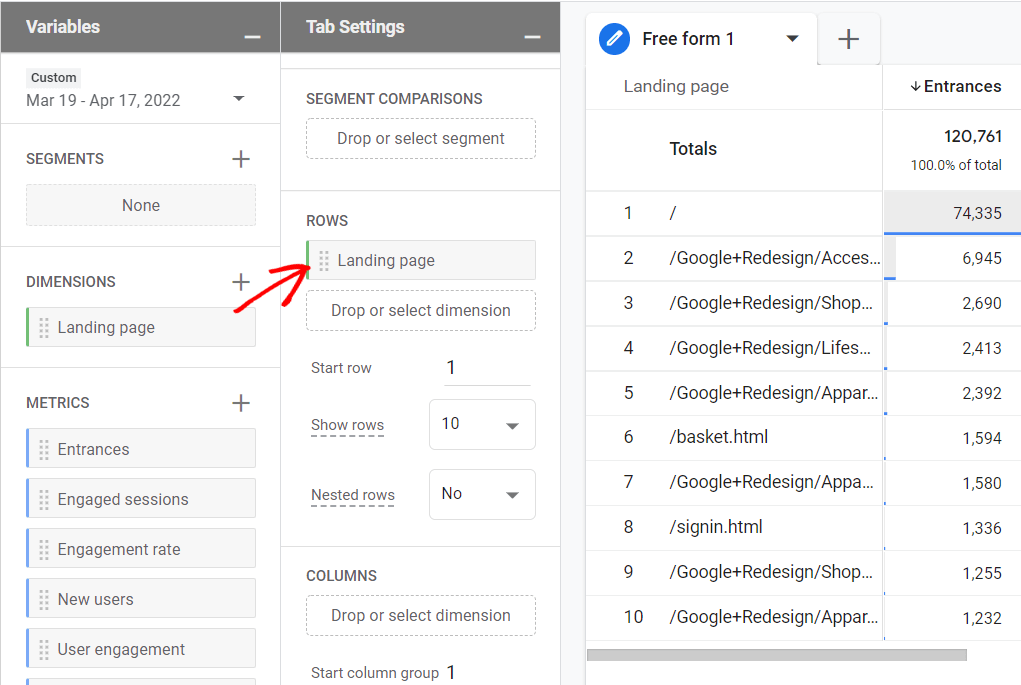
Click and drag your Landing page dimension into Rows:
Then, click and drag all of your metrics into Values:
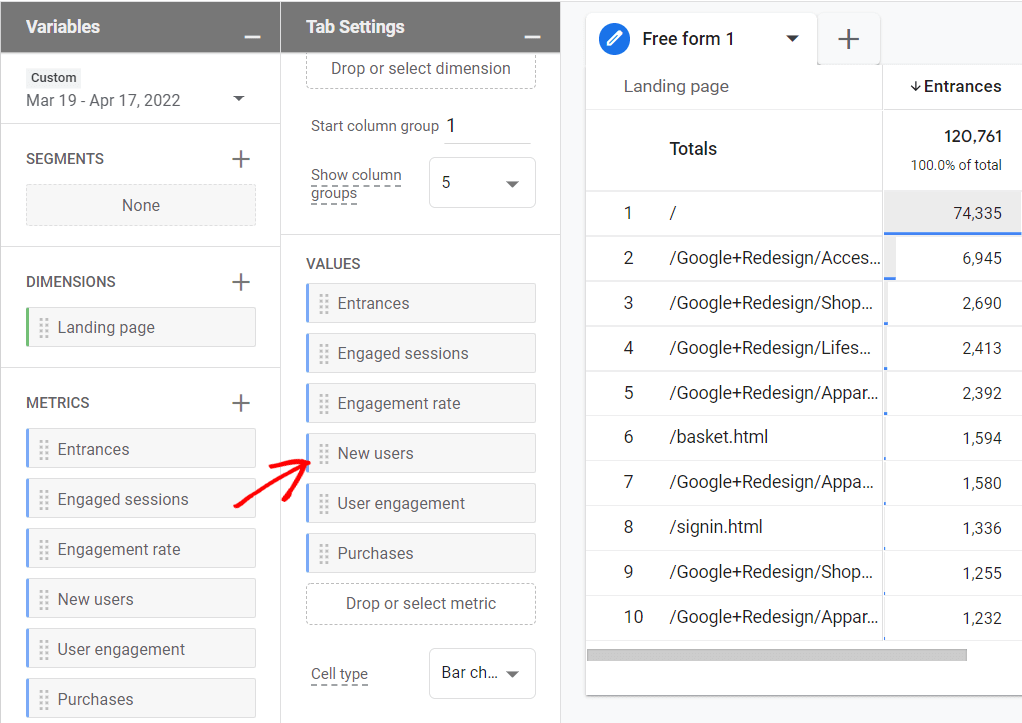
That’s it! You now have a report about your landing pages, including how many entrances there were on those pages, how engaged your users were, and whether or not they completed a purchase.
You’re free to add any other metrics to the report that make sense for your business. For instance, if you want to know how many visitors to a specific landing page completed a specific event, you can add the Event count metric and filter so that only a specific event appears.
Want Google Analytics 4 to be easier to use? If you’re using WordPress, you’re in luck! Get started with MonsterInsights today to simplify analytics and get the stats that matter.
With MonsterInsights, you can set up advanced tracking features in just a couple of clicks, then see your data in helpful, straightforward reports inside your WordPress dashboard.
Quickly and easily set up eCommerce tracking, video play tracking, outbound link click tracking, affiliate link tracking, PPC conversion tracking, and so much more.
Get started with MonsterInsights and simplify your analytics now.
We hope this article was helpful for you!
If you liked this article, you might also want to check out:
How to Create GA4 Dashboards (Step by Step)
How to Set up Google Analytics Click Tracking (Step by Step)
How to Track Form Submissions in Google Analytics & WordPress
And don’t forget to follow us on Twitter, Facebook and YouTube for more helpful Google Analytics tips.

