Google Analytics is full of powerful insights to help you make data-driven decisions and grow your business. Of course, in order to access those insights, you’ll need to know how to use the tool, which can get a little complicated.
So, in this article, I’ll share some quick Google Analytics tips and tricks you can start using today to find more of your important data in less time.
But first…
Why is it important to use Google Analytics?
Google Analytics is an important tool for understanding your website’s performance and user behavior. If you don’t have any idea (or if you have an incomplete picture) of what your visitors are doing on your website, you can’t really make informed decisions that grow your website or business.
That’s a problem.
Connecting your site with Google Analytics gives you access to data and insights that can help you:
- Identify your most valuable traffic sources and distribute your marketing budget and time where they’re needed most
- Understand how users interact with your content and identify areas for improvement
- Track specific events like purchases or signups
- Measure the effectiveness of your marketing campaigns and content strategies
- Identify potential technical issues or user experience problems that might be making it difficult for users to browse your website
- And more
Plus, Google Analytics is a free tool. Sure, it takes some time and energy (and possibly some budget) to get it set up correctly and learn how to use it, but it’s really a vital part of succeeding online.
6 Essential Google Analytics Tips for Any Website
I’ve been working with Google Analytics since 2011 and use it just about every day. While the transition to Google Analytics 4 changed a few of these tips, these are the basics that I come back to again and again when looking for the insights that will make the biggest Impact.
Let’s take a look.
Google Analytics Tip #1. Set up Key Events (Conversions)
Key events (previously called conversions) in Google Analytics represent the actions you want visitors to take on your website, such as making a purchase or submitting a form. Setting up key events allows you to measure the success of your marketing efforts and identify areas for improvement.
Example: Let’s say you have a blog post that’s getting a lot of traffic. That’s great! When you set up key event tracking, though, you see that you’re really not getting a lot of sales or signups from all of that traffic.
With that data in mind, you create a downloadable PDF that’s closely related to the subject of the page and design a nice popup offer for it. Now, you’re grabbing email addresses left and right and growing your email list much faster than before.
To create a key (conversion) event in GA4:
First, head to Admin » Key events:
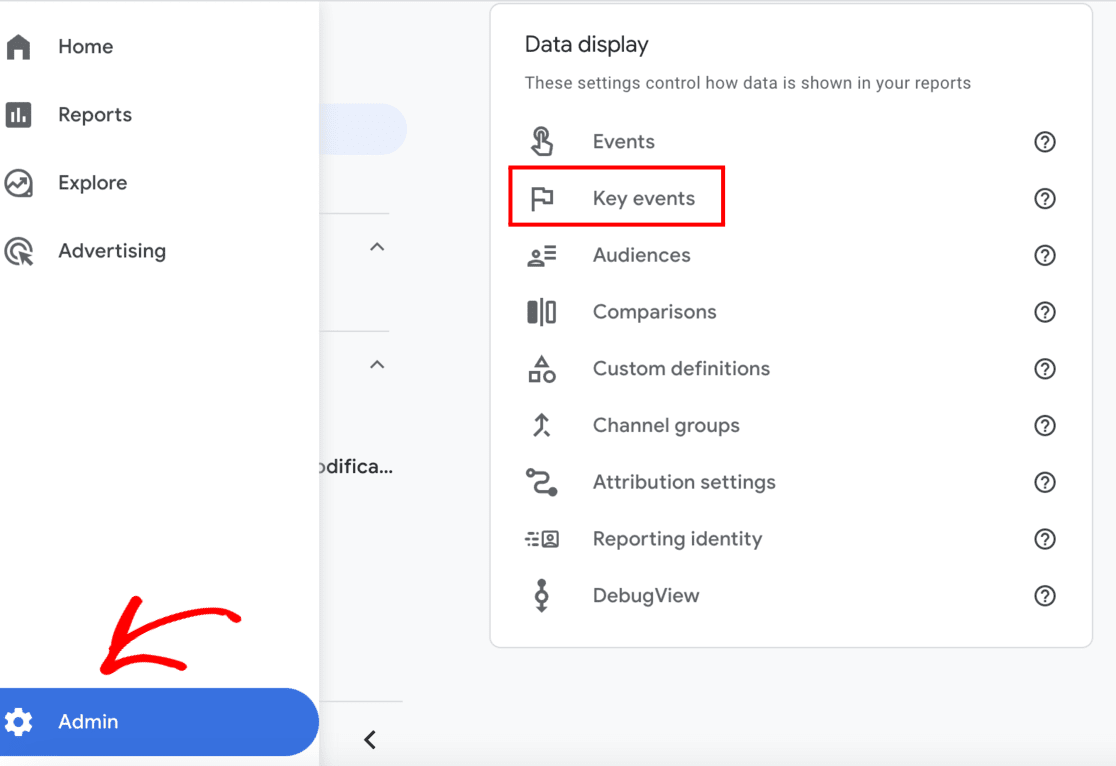
Then, you’ll be able to click the switch to mark an event as a key event and track it as a conversion:

Not seeing an event there that you really wish was set up, like an eCommerce purchase or form submission? If your website is a WordPress site, MonsterInsights can help. Check out our Complete Guide to GA4 Conversion Tracking for WordPress.
Google Analytics Tip #2. Watch Engagement Metrics
Google Analytics 4 places an emphasis on engagement by providing multiple engagement metrics in its reports. Are your visitors sticking around to read your content? Are they clicking on other pages or elements of your website? These are important signals about how your site is performing overall.
Since whether or not your audience is engaged is a measurement of overall website health, you should definitely keep an eye on it. Here are the metrics to watch:
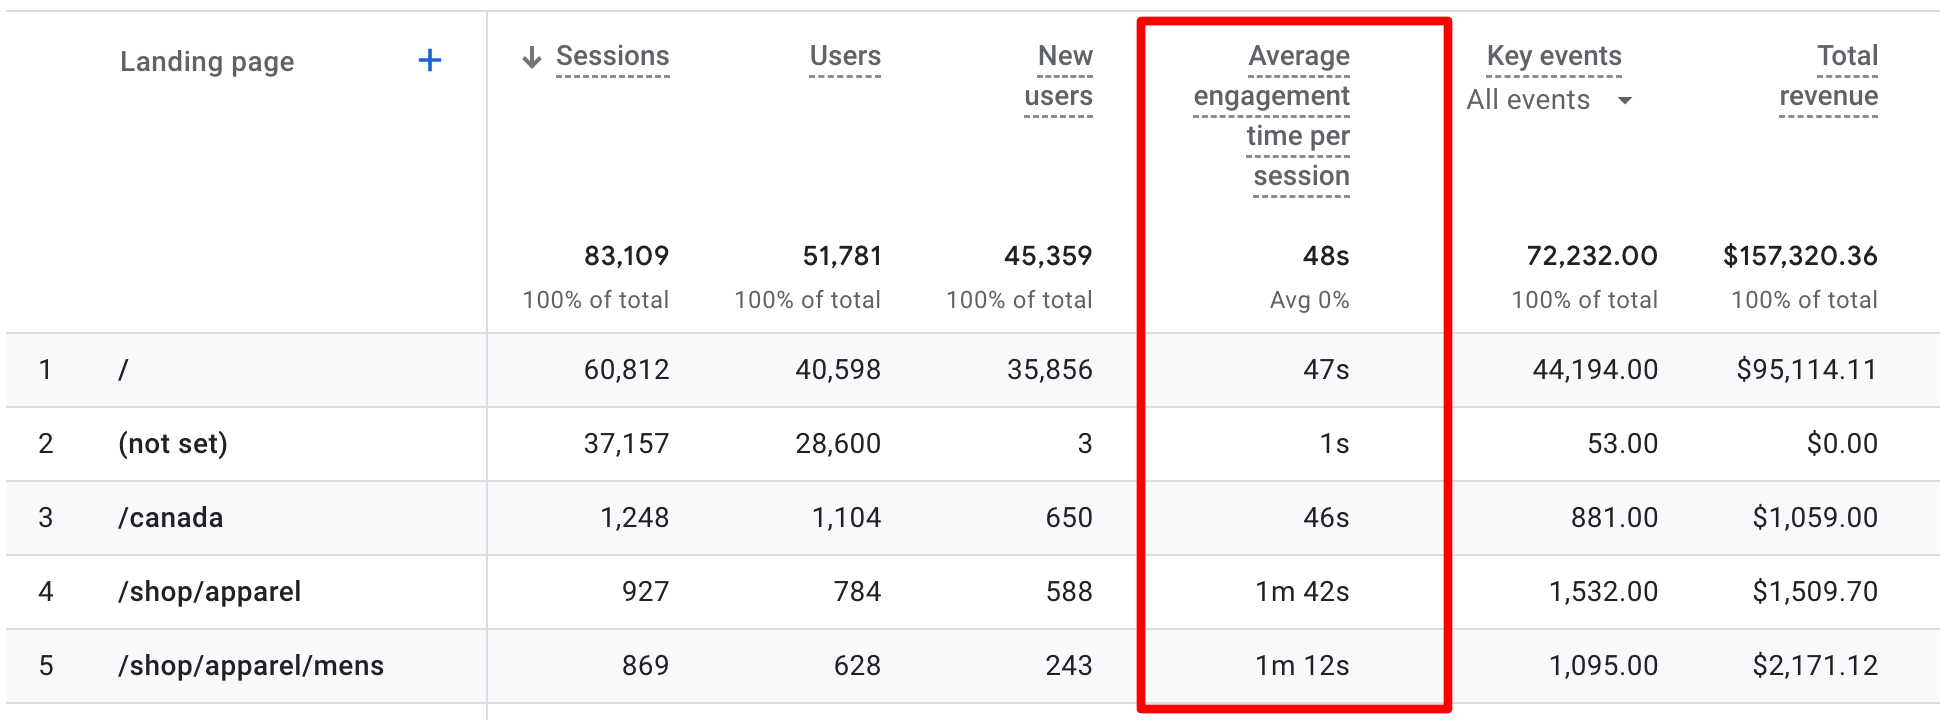
- Average engagement time per session: The average amount of time users spend actively interacting with your website during a session
- Engaged sessions: The number of sessions that lasted longer than 10 seconds, completed an event (like clicking on something), or had at least 2 page views
- Engagement rate: The percentage of sessions that were engaged sessions
Example: Let’s say that you’re looking at your Landing page report. You notice that you have a few pages with a high average engagement time per session (how long visitors are spending on your site when they land on that page), but your home page is lower than you think it should be. So, you make a few changes to your home page design, making it clearer what the most important things are for your users to do when they land there. Those changes end up increasing your average engagement time per session over the next couple of weeks, also resulting in a few more conversions.
That’s a Google Analytics win!
By monitoring engagement metrics by page or channel, you can improve your website or marketing strategy and grow your business or online presence.
To find engagement metrics in Google Analytics:
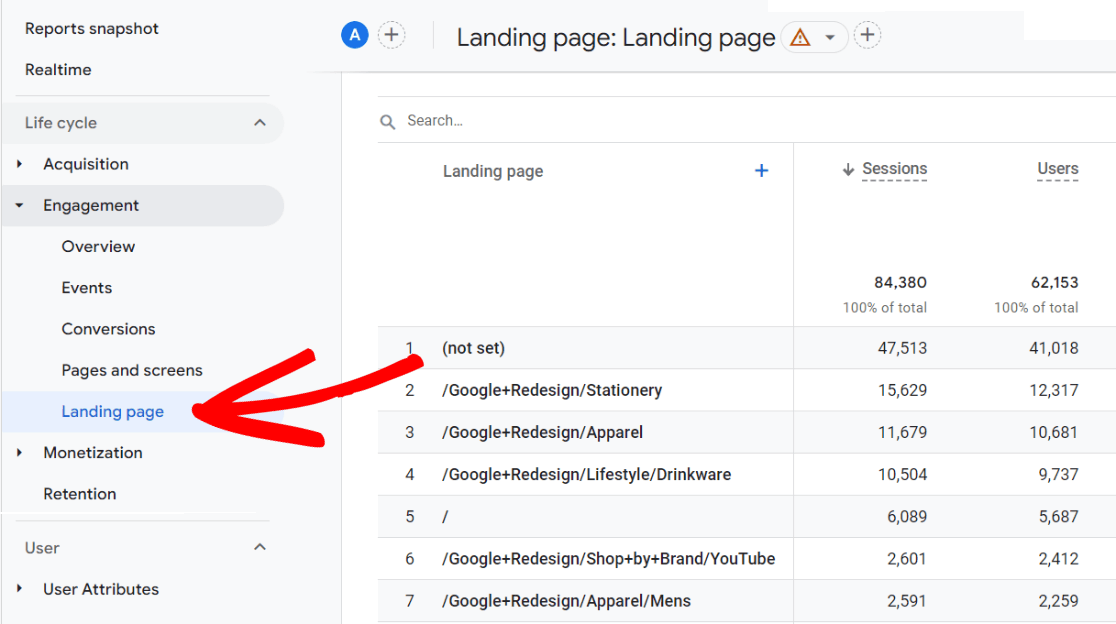
You can find engagement metrics in multiple reports in Google Analytics. One of the most important reports to use for engagement reporting, though, is the Landing pages report.
To find it, head to Reports » Engagement » Landing page:
There, you’ll see the Average engagement time per session metric:
For some actionable tips to improve your engagement metrics, check out 8 Proven Ways to Increase User Engagement on Your Website.
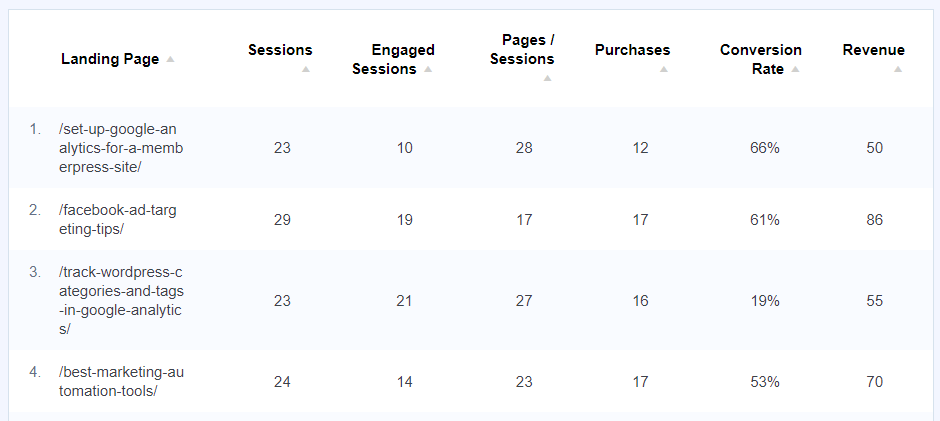
MonsterInsights users, you can access some engagement metrics any time in your WordPress dashboard, including in the Landing Page Details report:
Google Analytics Tip #3. Add Secondary Dimensions
“Secondary dimensions” sounds like an intimidating phrase, but once you get to know what they are, you’ll love them. Secondary dimensions allow you to break down your data further so you can see a bit deeper.
Here are a few examples:
- Instead of just referral traffic, you can see the domains your referral traffic came from
- Instead of just your organic traffic, see your organic traffic broken down by which pages organic visitors landed on
- Instead of just traffic from the United States, see which cities your users came from
To add a secondary dimension in Google Analytics:
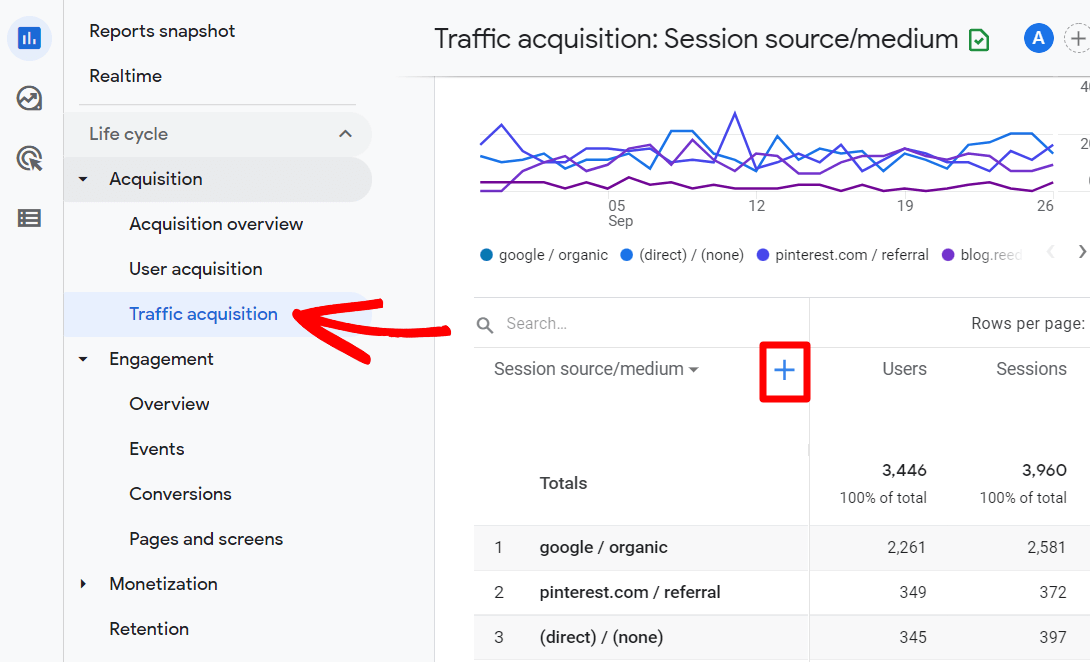
You can add a secondary dimension to any of the report tables in Google Analytics. For example, to add landing pages to your organic traffic reports, head to Reports » Acquisition » Traffic Acquisition and click the blue + button:
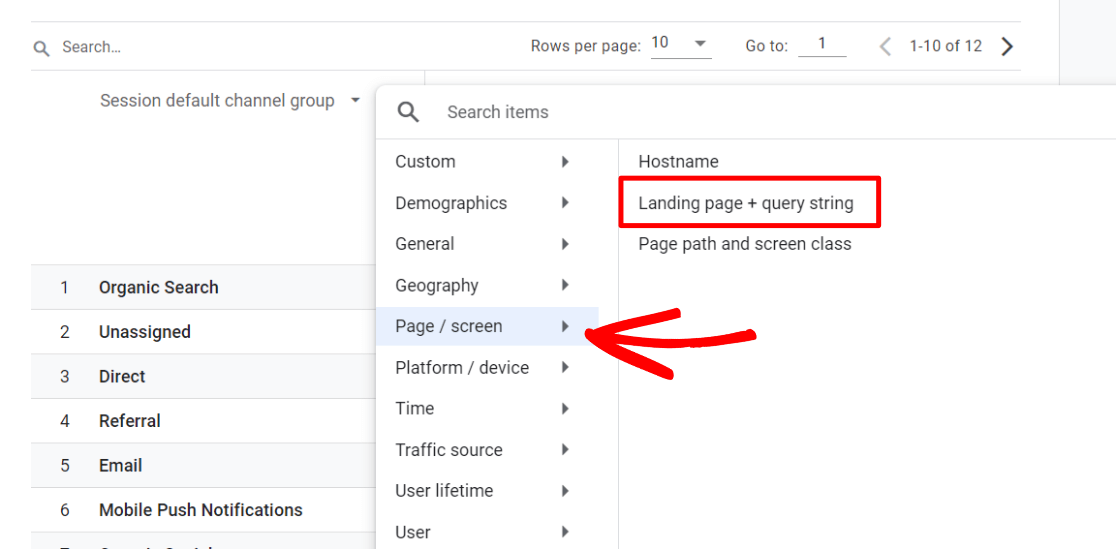
From the dropdown, select Page/screen » Landing page + query string:
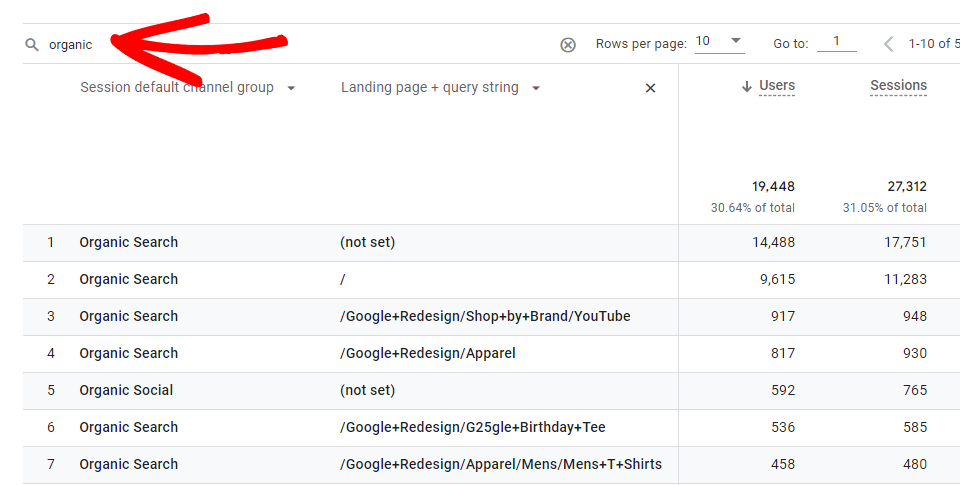
Finally, type “organic” into the Search bar to isolate your organic traffic:
Play around with your secondary dimensions in various reports. Try adding:
- Device category (mobile, desktop, tablet)
- Source/Medium (e.g., google/organic, facebook/referral)
- Landing page
- Country or city
Google Analytics Tip #4. Try Explore Reports
The Explore section in GA4 allows you to create custom reports. So, anything you wish you could see in your main reports but can’t seem to find, or any super custom report that makes sense for your site can be created there.
Try not to be intimidated by them! I’ll admit, even as an Analytics user for 10+ years, I was intimidated by them at first. The more you play around with them, though, the more you’ll understand how they work well enough to create some good ones. Don’t worry, though — I’ll supply some tutorials!
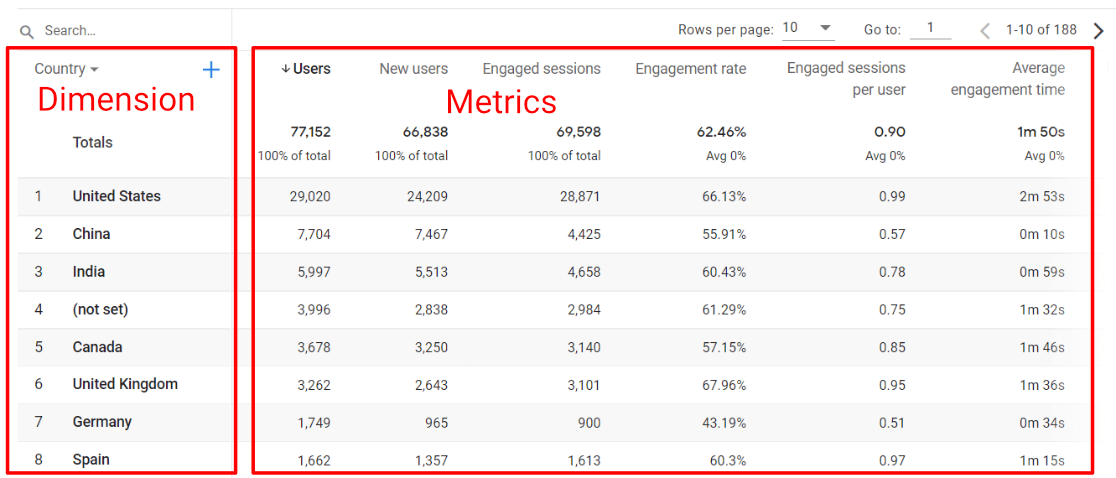
Basically, you get to make a report and decide what’s in the first column (dimension) and what’s in the other columns (metrics):
How to create an explore report in GA4:
For an example, let’s build a social media traffic report.
MonsterInsights users, you get one of these anyway, without building your own:
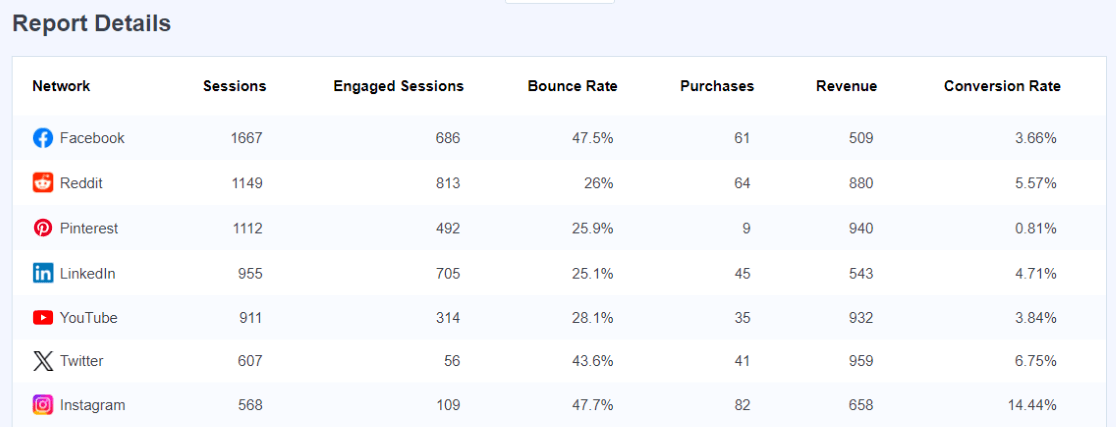
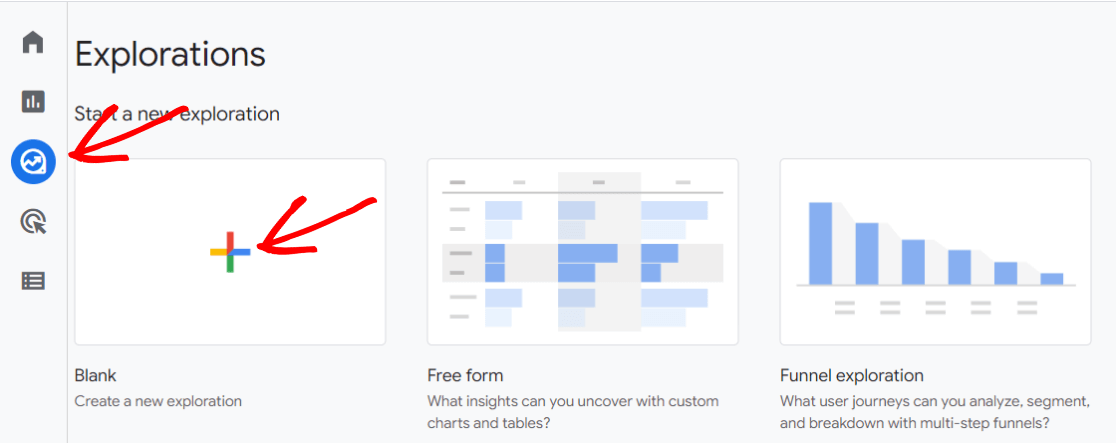
But let’s go over building one. To start, head to the Explore tab in Google Analytics and click on Blank:
Import the following Dimensions:
- Session source
- Session default channel grouping
- Landing page + query string
2. Import the following Metrics:
- Sessions
- Engaged sessions
- User engagement
- Engagement rate
- Key events (formerly called conversions)
- Purchases or Transactions if you run an eCommerce website
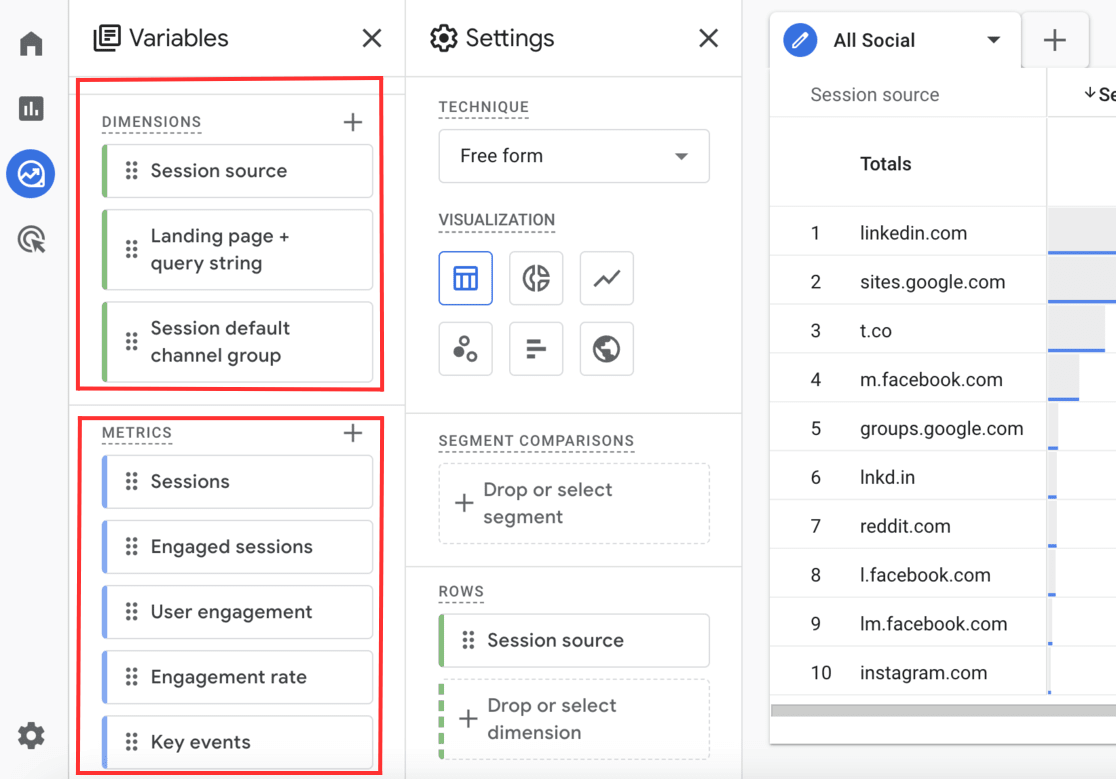
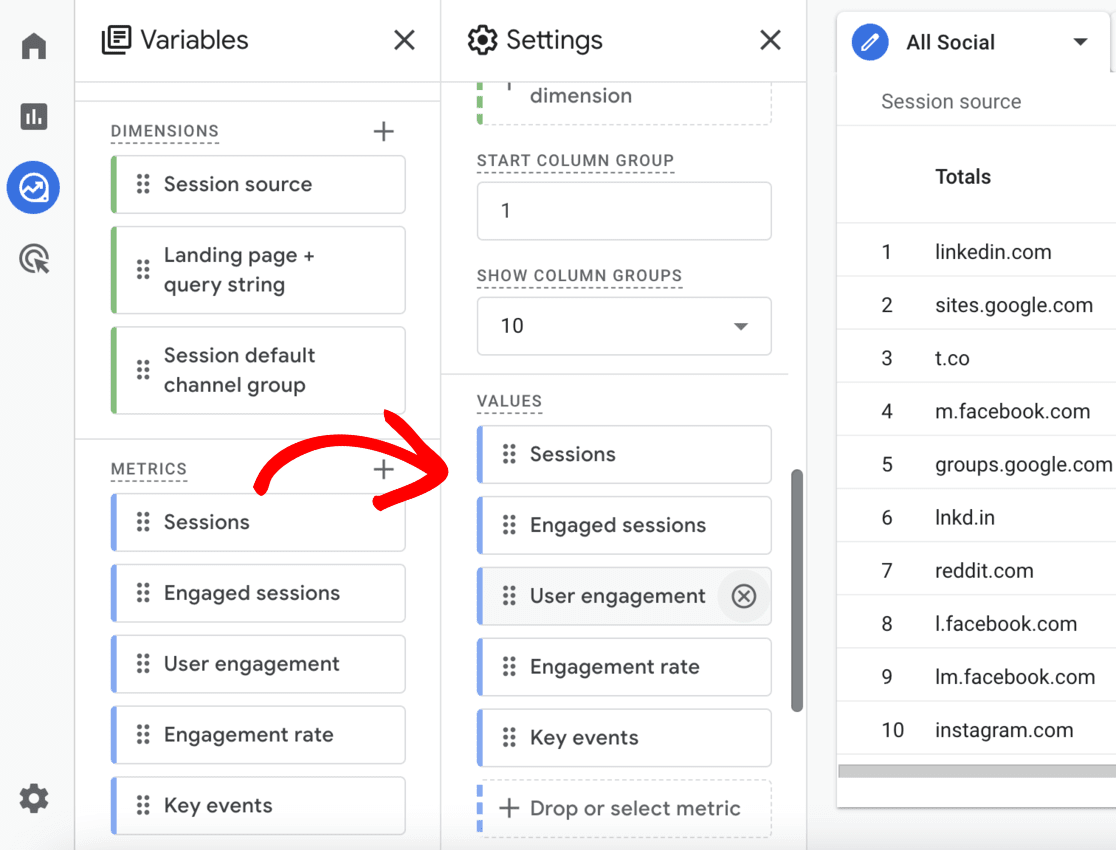
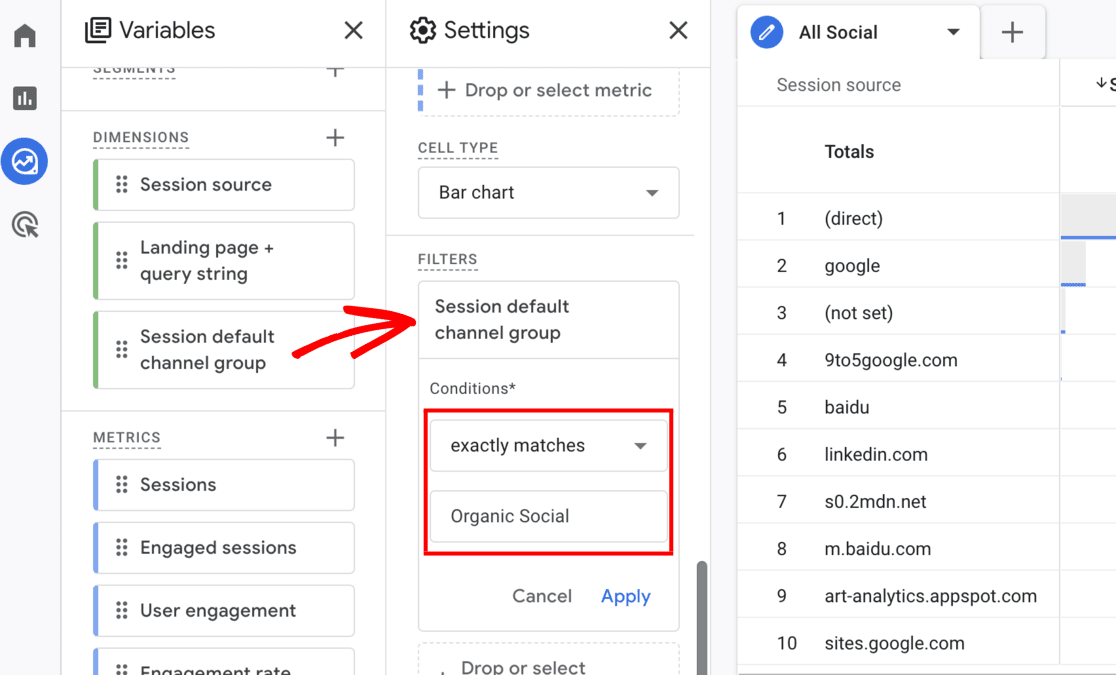
3. Click and drag Session source from your Dimensions into the Rows box.
4. Click and drag all five Metrics into the Values box.
5. Click and drag Session default channel grouping from your Dimensions into the Filters box.
6. Configure your filter to exactly matches and type/choose Organic Social.
Now, you should have a social media channels report that looks like this:
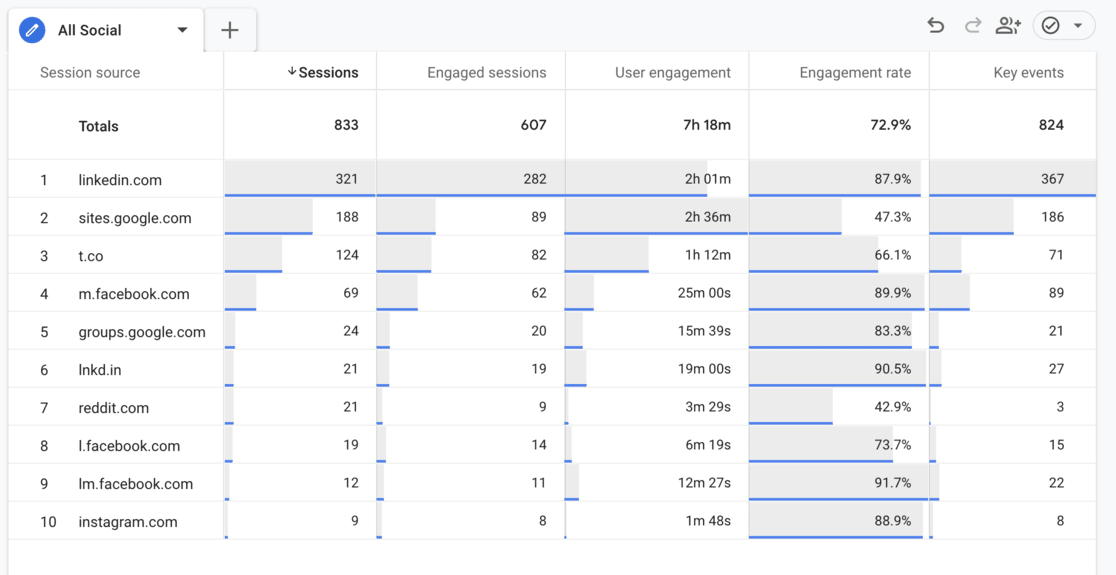
Want to view your social traffic by landing page instead of social network? Just swap out Session source for Landing page + query string in the Rows box.
Explore reports are particularly useful for uncovering insights tailored to your specific business questions and needs. With a little practice, you’ll be putting them together in no time.
For a full tutorial on building Explore reports, check out How to Create Google Analytics 4 Custom Reports (Step by Step).
Google Analytics Tip #5. Modify the Reports & Dashboards
The main reporting dashboards in Google Analytics provide an overview of key metrics, but you can customize them to better align with your business goals. You can also customize the tables that appear in the reports.
For example, on any of the dashboards (like the Reports snapshot dashboard), you can click the pencil icon in the upper right corner to edit which cards you see and the order in which they appear.
How to customize dashboards in GA4:
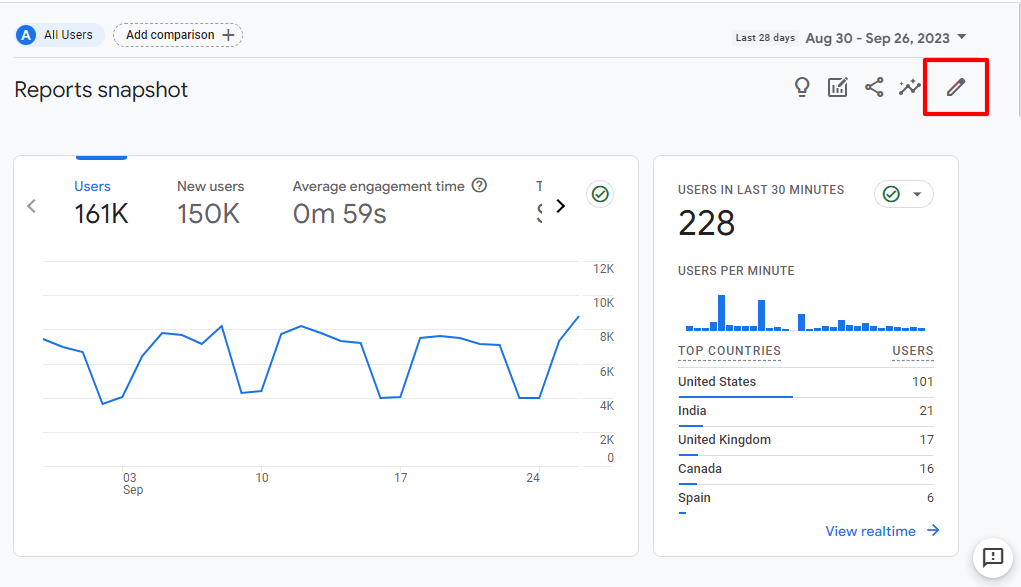
That’ll open a Customize Report side panel:
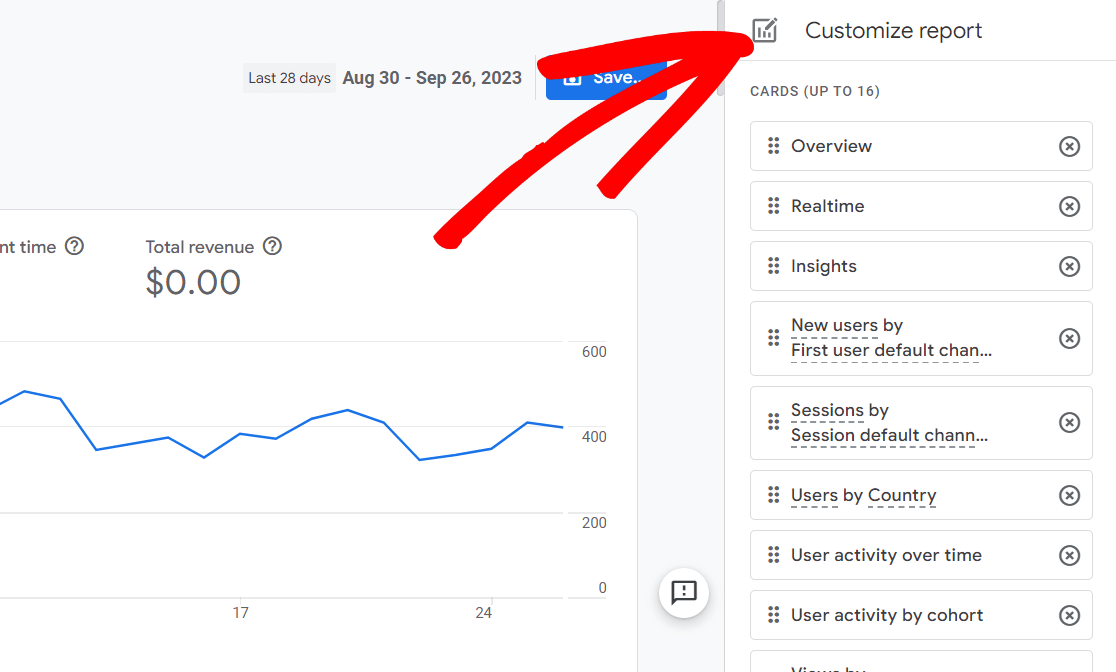
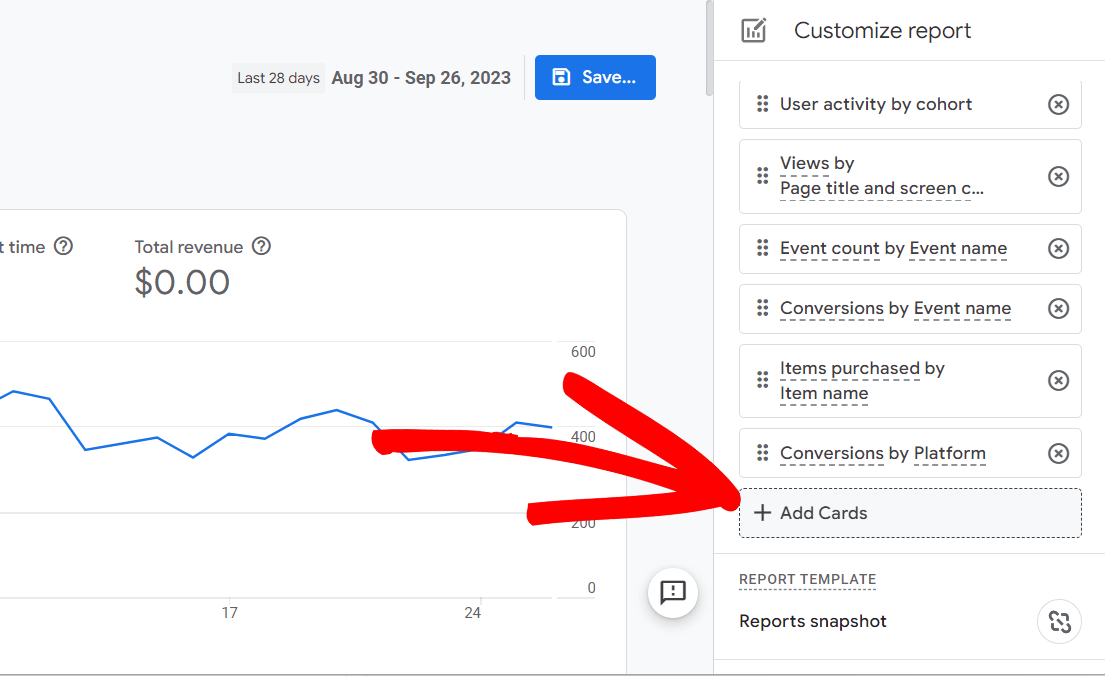
You can rearrange the cards by clicking the six dots on the left and dragging a card to a new location. Or, to create a new report card, scroll to the bottom of the list and click Add Cards:
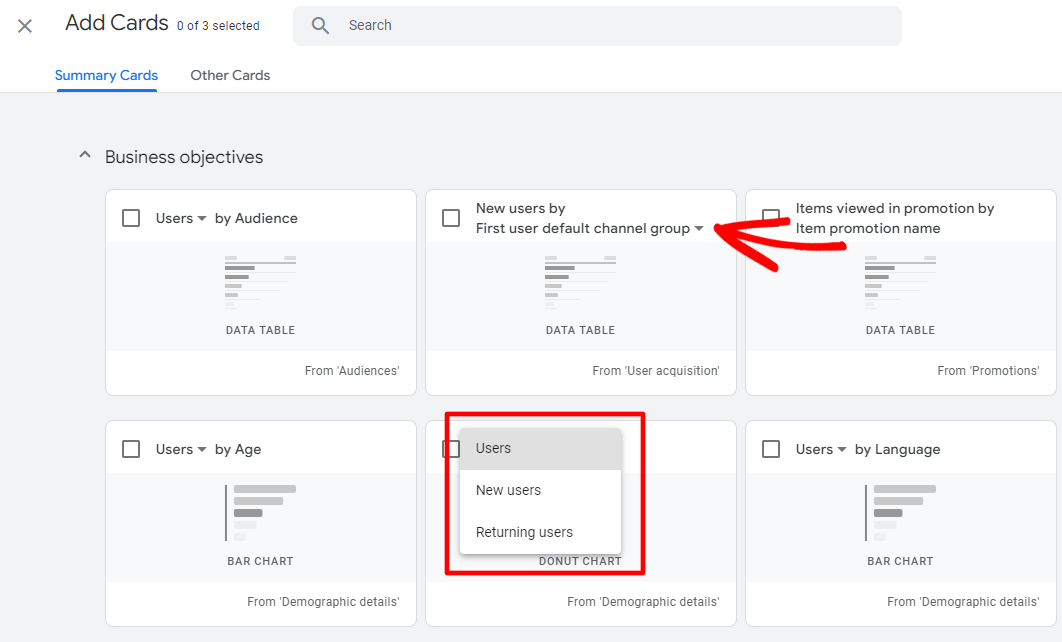
Here’s where you’ll be able to select from Google’s pre-made cards to add to your dashboard. Make sure to check out the other dimensions that are available for each card by clicking the down arrow when it’s available:
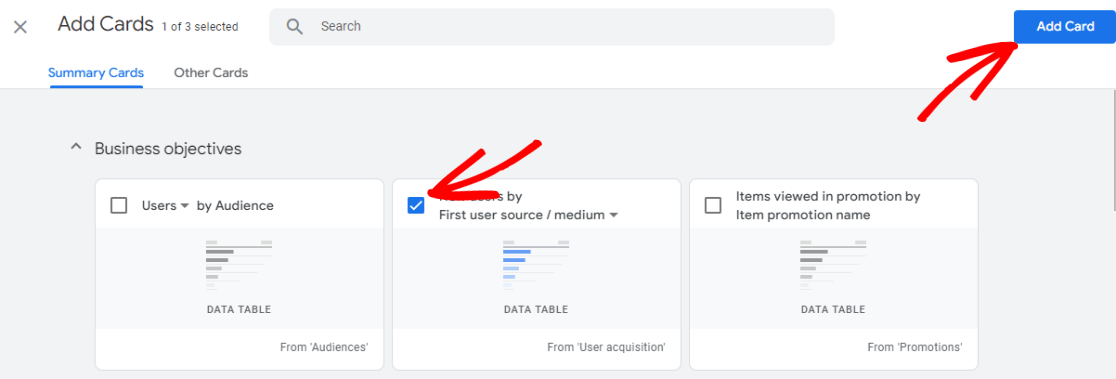
If you find a card you’d like to add to your dashboard, click the checkbox, then click the blue Add Card button.
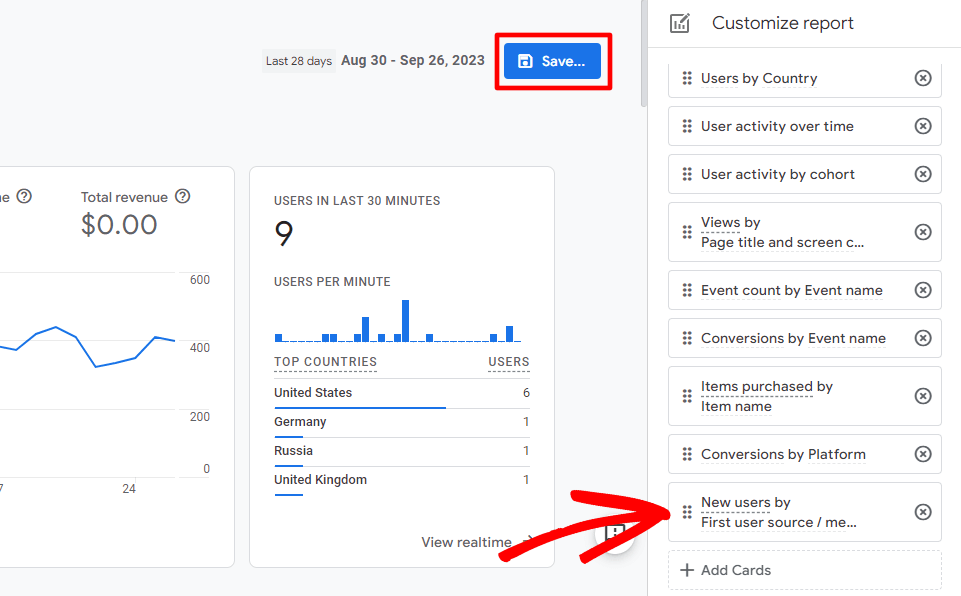
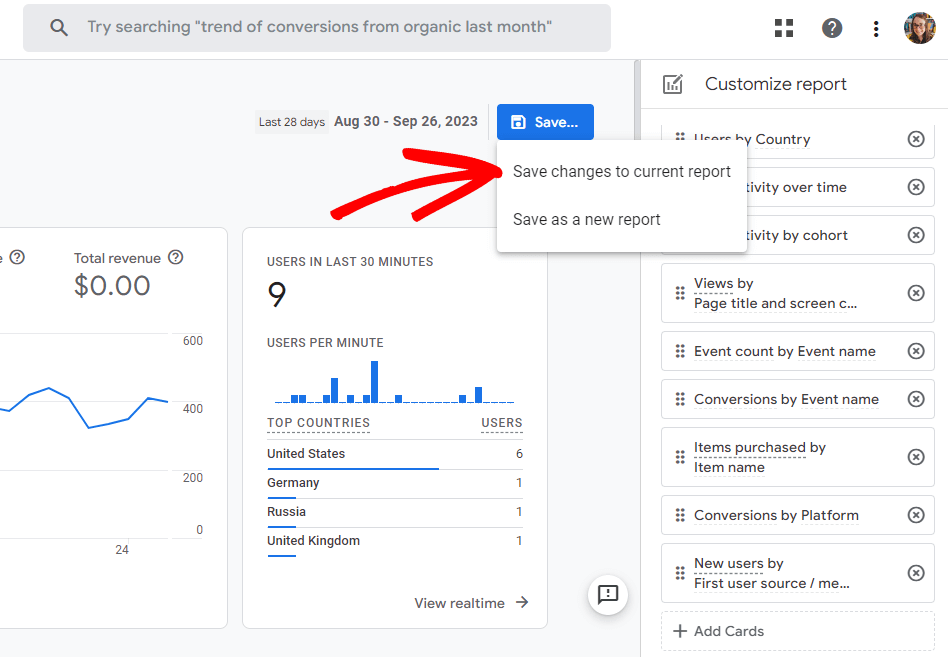
Your new card will automatically be added to the end of your list of cards, so it’ll be at the end of your report. If you want to move it up, remember to click and drag it up into a new position. When it’s situated where you’d like, go ahead and click the blue Save button:
Next, unless you’re trying to create a whole new dashboard, click the Save changes to current report option:
How to customize report tables in GA4:
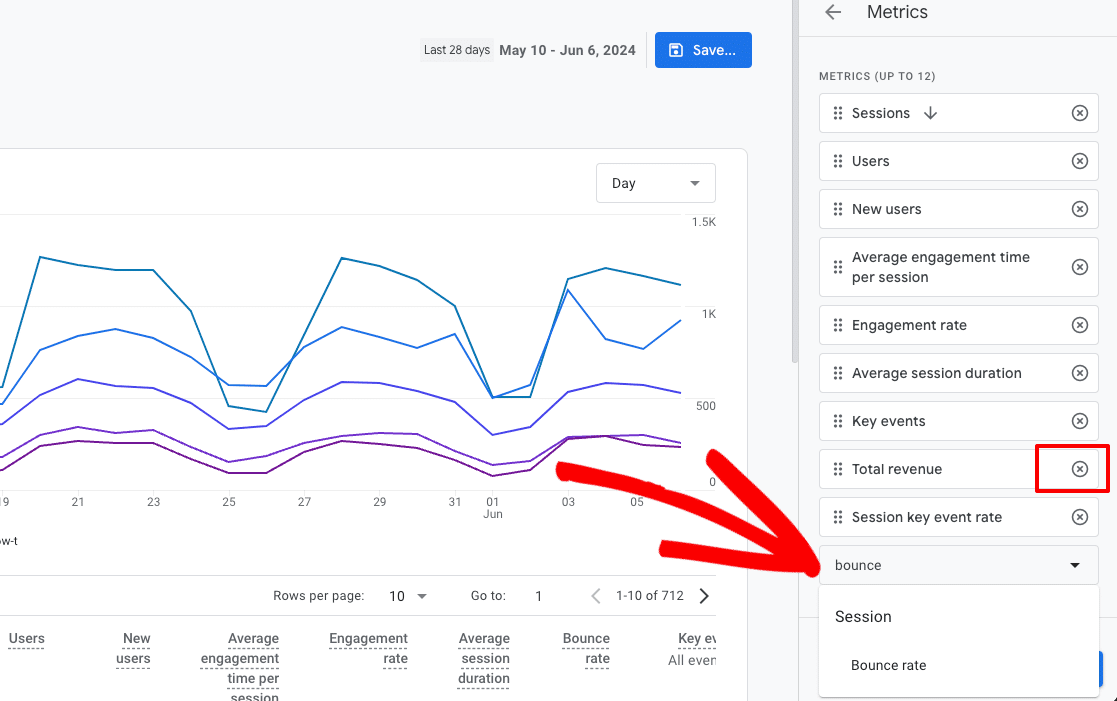
Let’s say you run a blog or news website. You make money from ads, but you don’t need eCommerce metrics like revenue in your reports. Plus, you’d love to see your bounce rate for each page.
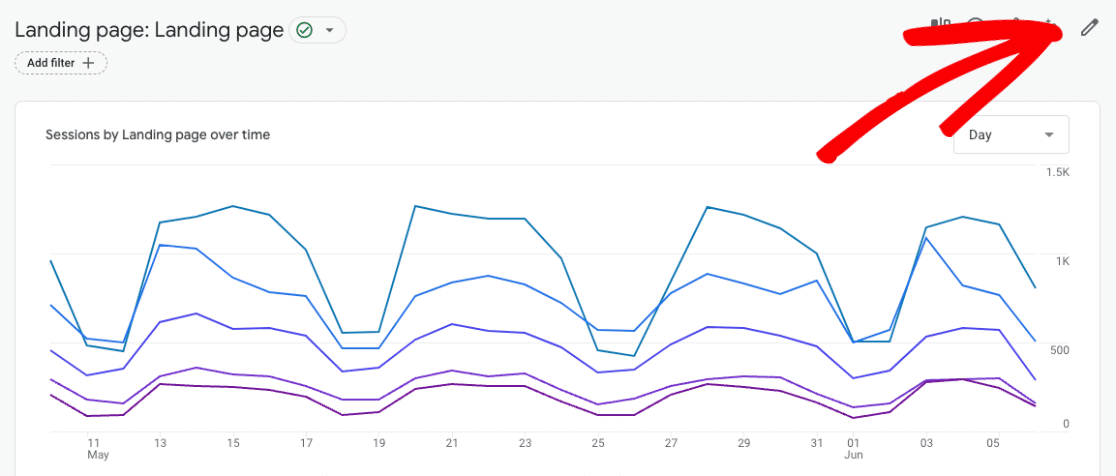
So, let’s modify the Landing page report to better suit your needs. Click the pencil icon in the upper right corner:
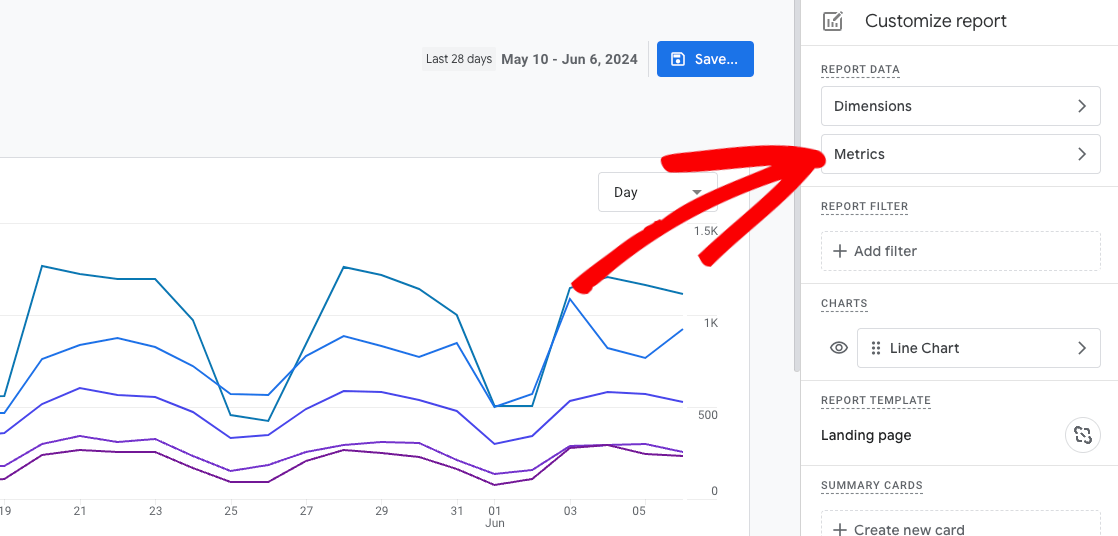
Next, click Metrics:
Now, use the dropdown at the bottom to add a metric (like bounce rate) or click the X to remove metrics you don’t need (like total revenue):
When saving, make sure to click the Save changes to current report option.
That’s it! Go through your reports and tailor them to your needs.
Google Analytics Tip #6. Use Campaign Tracking
Whether you’re brand new to Google Analytics or just want to up your tracking game, one of the best things you can do is use campaigns.
Campaigns are an awesome way to track some extra information about your traffic, and group traffic together in ways that make sense.
For example, let’s say you’re running a summer sale or an influencer campaign on social media and via email. If you use the same campaign name for your social posts and emails, you can see how your whole campaign did as a whole, all in one spot.
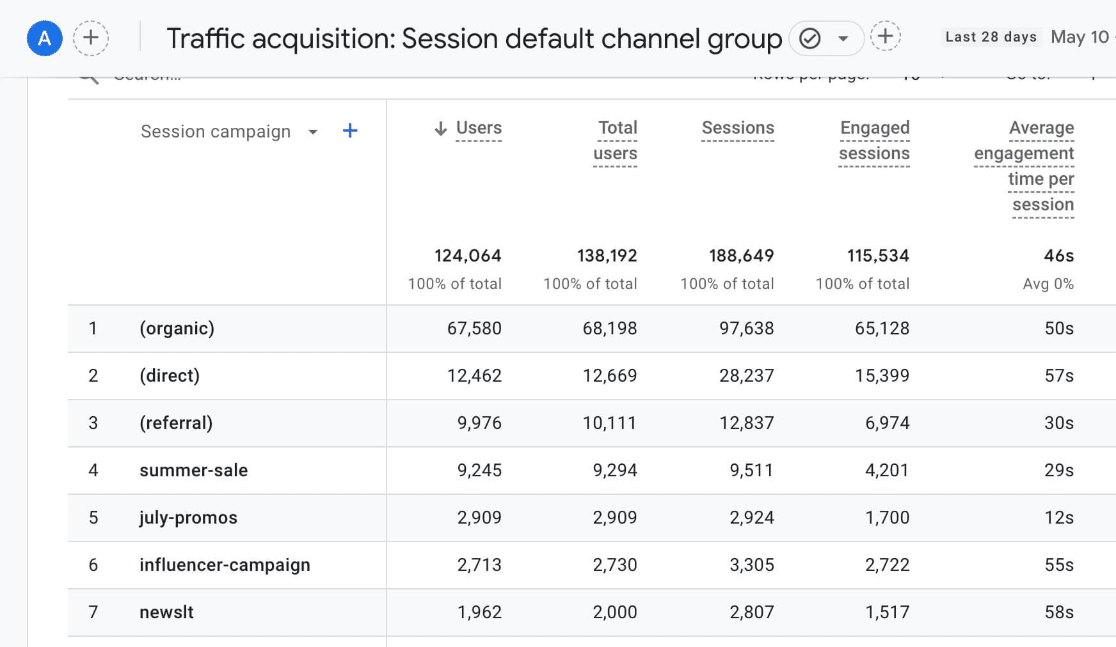
Then, add Session source/campaign as a secondary dimension to break down the data further:
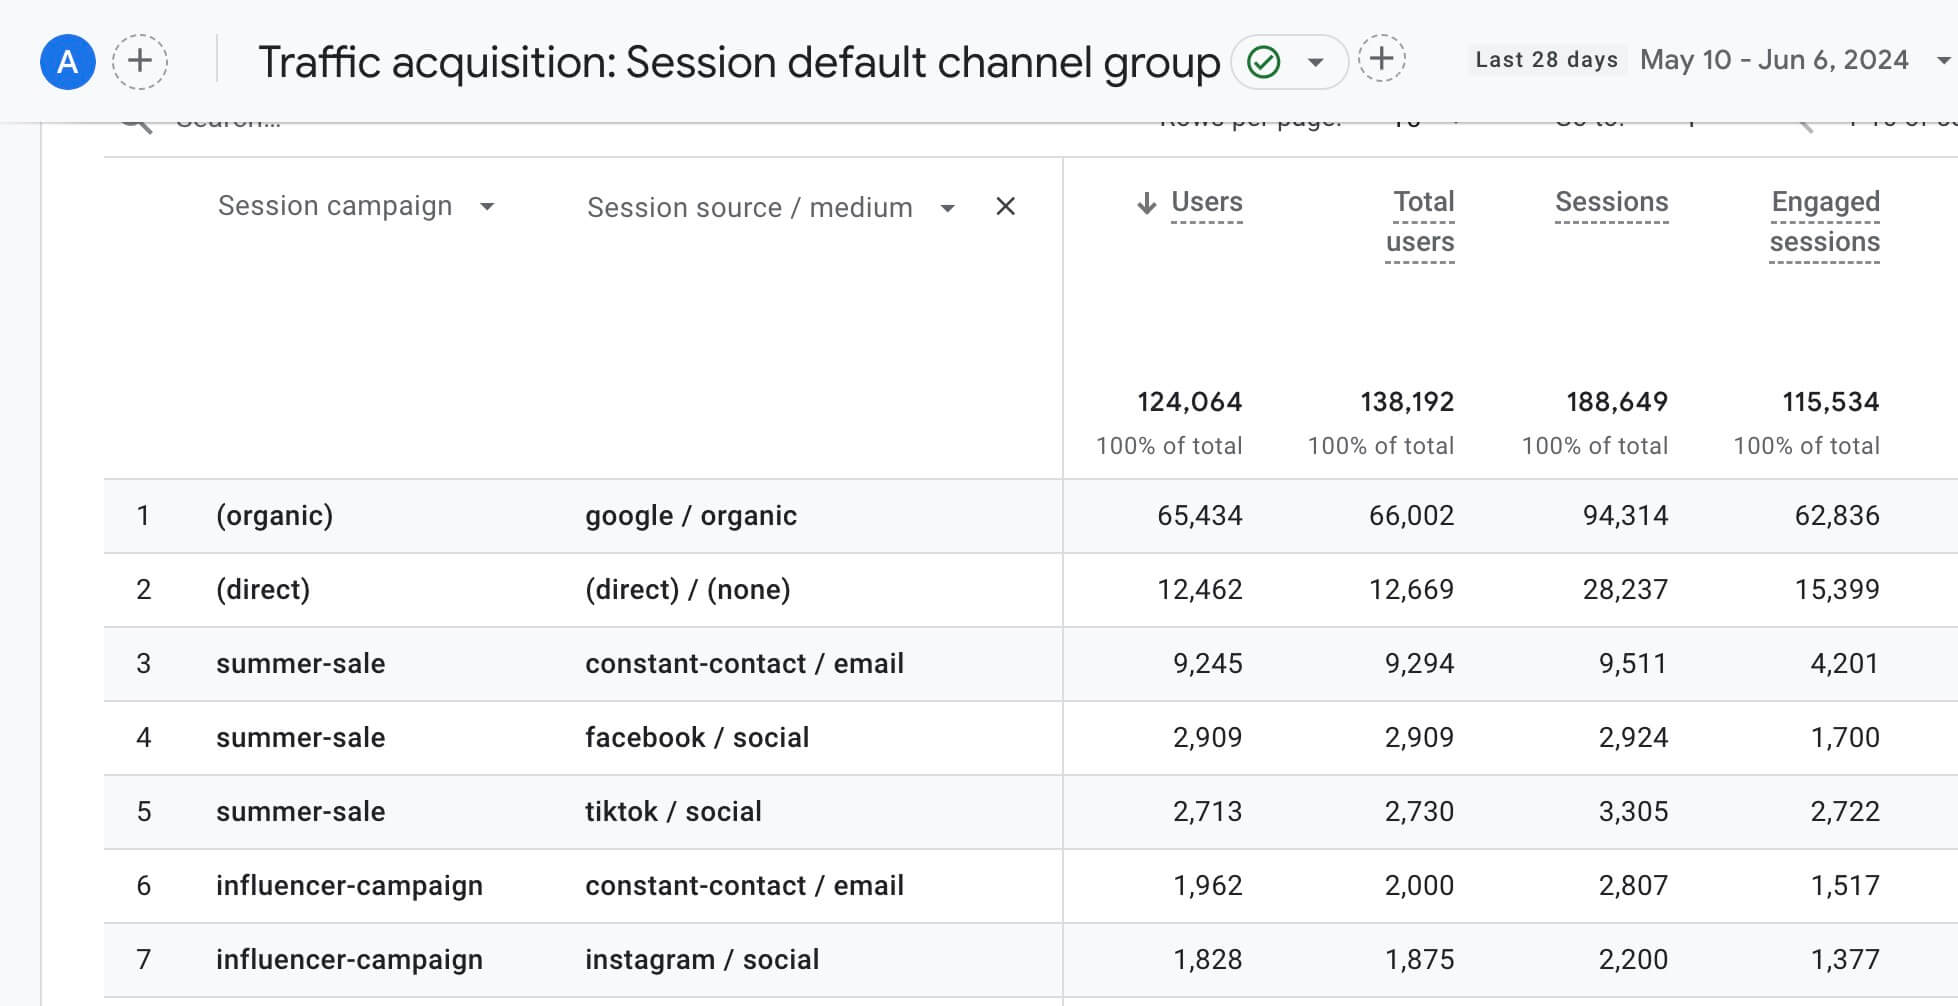
To use campaigns, all you have to do is add your campaign’s source, medium, campaign, and content to the URL you share, like this:
yoursite.com/shop/?utm_source=tiktok&utm_medium=social&utm_campaign=summer-sale&utm_content=newslt07-04
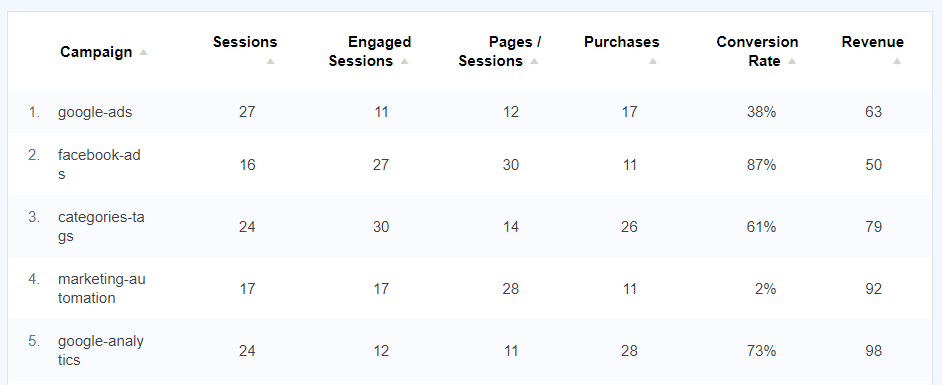
MonsterInsights users, you’ll find your Campaigns report right inside your WordPress dashboard:
For more on how to set up and track campaigns, check out How to Set Up Marketing Campaign Tracking in Google Analytics.
BONUS Google Analytics Tips
Here are a few other tips I recommend taking a look at:
- Set up enhanced measurement
- Use Google Analytics segments for reporting
- Block any referrer spam
- Track all your link clicks
- Use annotations to keep track of all your marketing efforts
That’s it!
By using the tips and features I discussed in this article, you can gain valuable insights into user behavior, optimize your marketing efforts, and ultimately grow your business. Start exploring GA4 today and unlock the full potential of your website data!
You might also want to check out:
Top 11 Important Google Analytics Metrics to Track
7 Best Google Analytics Reports for Business Growth
9 Top eCommerce Metrics & KPIs to Track in Google Analytics 4
Haven’t tried MonsterInsights yet? What are you waiting for?
You can also follow us on X, Facebook and YouTube for more free tutorials.
