Website owners often feel frustrated when they can’t find their bounce rate data in Google Analytics 4 (GA4). Many users switched from Universal Analytics expecting to see the same familiar metrics, only to discover that bounce rate isn’t where it used to be.
In GA4, bounce rate has been replaced by other engagement metrics. However, the good news is that bounce rate still exists in GA4! It’s just hidden by default and calculated differently than before.
In this guide, I’ll show you exactly where to find bounce rate in Google Analytics 4, explain how it’s calculated differently now, and share better engagement metrics you can use to evaluate your website’s performance.
Website Bounce Rate Tracking: Video Walkthrough
Understanding Bounce Rate in Google Analytics 4
Many users like to keep an eye on their bounce rate as an indicator of how engaging their page (or whole website) was to visitors who landed there. A website’s bounce rate shows how many visitors left the site without clicking on any more pages or completing any conversions. Basically, it means they maybe read your page (or didn’t even do that), then left.
Although many website owners and marketers have historically used bounce rate as a measure of success, it does have some flaws. That’s why, instead of bounce rate, Google Analytics 4 reports show engagement metrics, which give you a better idea of how your pages and content are really performing.
That said, although bounce rate isn’t a main metric in Google Analytics, you can still access it.
Website Bounce Rate vs. Engagement Metrics
In the previous version of Google Analytics, a high bounce rate meant that too many people were landing on your page and then leaving without triggering any events or visiting any other pages.
For some websites and some content types, tracking the bounce rate made sense. For others, it wasn’t an accurate way to measure page performance.
For example, let’s say you have a long, well-written piece of cornerstone content that dives deep into a subject and answers questions. If a visitor lands on your page, spends 5 minutes reading through the whole thing, and then leaves, that would be counted as a bounce in the old version of Google Analytics.
Even though that visitor was super engaged by your content, you’d have no way of knowing that by looking at the bounce rate. To address this limitation, Google Analytics 4 introduced “Engaged sessions” as a new metric. Engaged sessions are sessions that:
- Include an event (like a click or form submission)
- Include more than one pageview
- Last more than 10 seconds
The 10-second timing element makes engagement a more meaningful metric to track than bounce rate ever was!
So, in Google Analytics 4, bounce rate is simply the traffic that didn’t count as engaged sessions.
Other engagement metrics you can use in Google Analytics include engagement rate, average engagement time, and engagement time per page. For more information on engagement metrics, check out Top 5 User Engagement Metrics for Your Website Explained.
Where to Find Bounce Rate in Google Analytics 4
Although bounce rate isn’t a metric in any of the standard Google Analytics reports, you can actually add it back into your reports.
Before we dive into our tutorial, though, note that bounce rate in Google Analytics 4 is calculated differently than it was in Universal Analytics. So, if you’re used to tracking your bounce rate in an older Google Analytics version, there will be sessions that are not counted as bounces that would have been previously.
In Google Analytics 4, the bounce rate is simply sessions that aren’t engaged. So, they’re sessions that:
- Didn’t last longer than 10 seconds
- The user didn’t click anything that fired an event
- The user didn’t view any more pages
How to Add Bounce Rate to the Pages and Screens Report
Want to be able to see your bounce rate in your main pages report? You’re in luck — you can customize your core reports in GA4. Add important metrics to the reports, or even remove ones you don’t use (like Revenue if your site isn’t eCommerce) to make the reports right for your site.
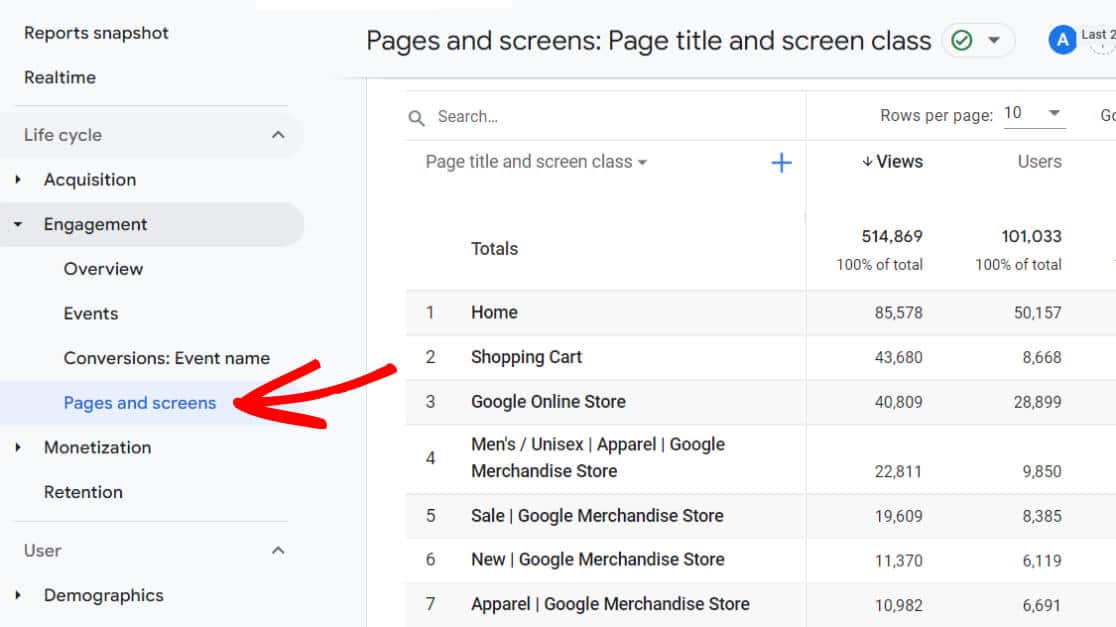
Step 1: To add bounce rate, navigate to Engagement » Pages and screens:
Step 2: Now click the pencil icon in the upper right of your screen:

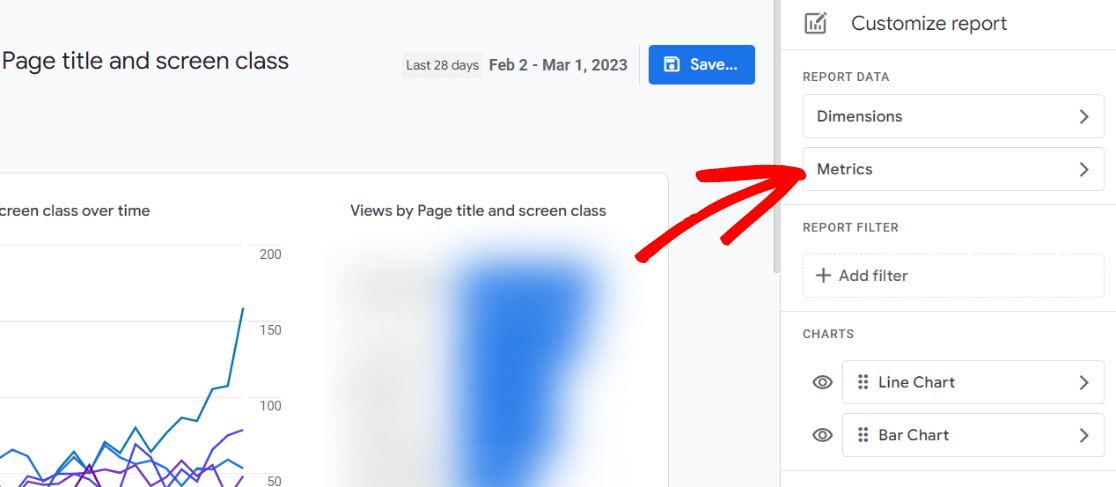
Step 3: Next, a sidebar will open. Click on Metrics:
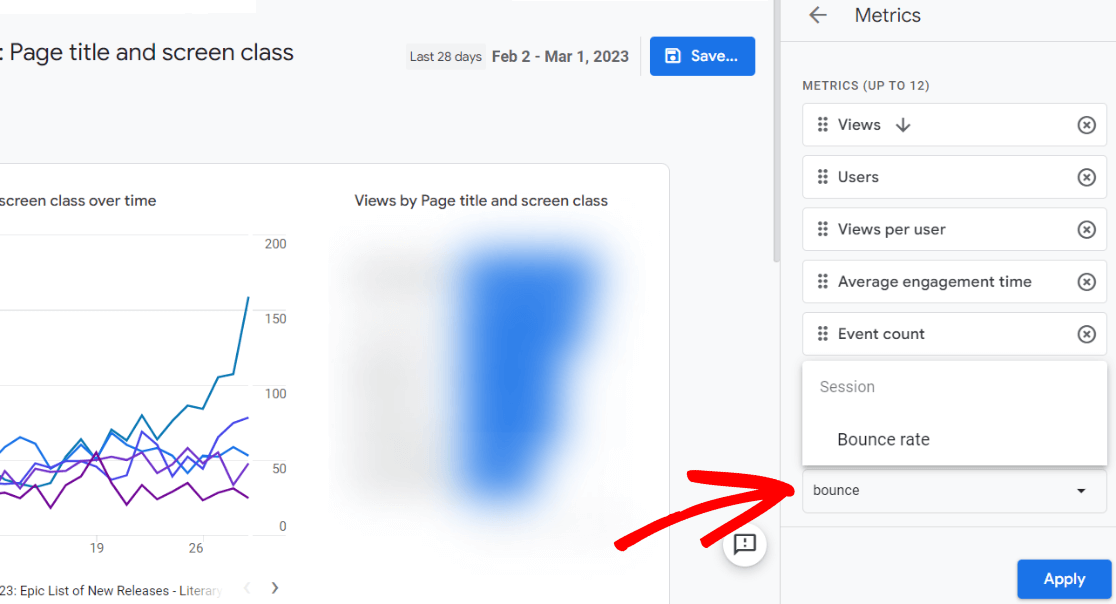
Step 4: In the sidebar options that appear, click on the bottom Add metric option, then start typing “bounce” to find and select Bounce rate.
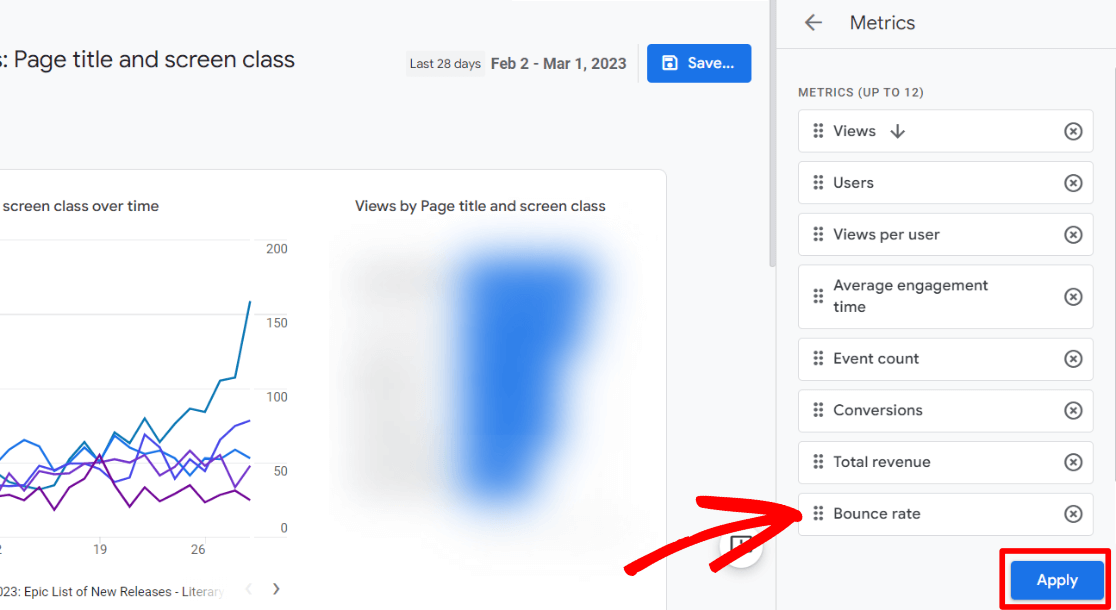
Step 5: Once it’s been selected, you’ll see Bounce rate added to the list of Metrics. Click Apply.
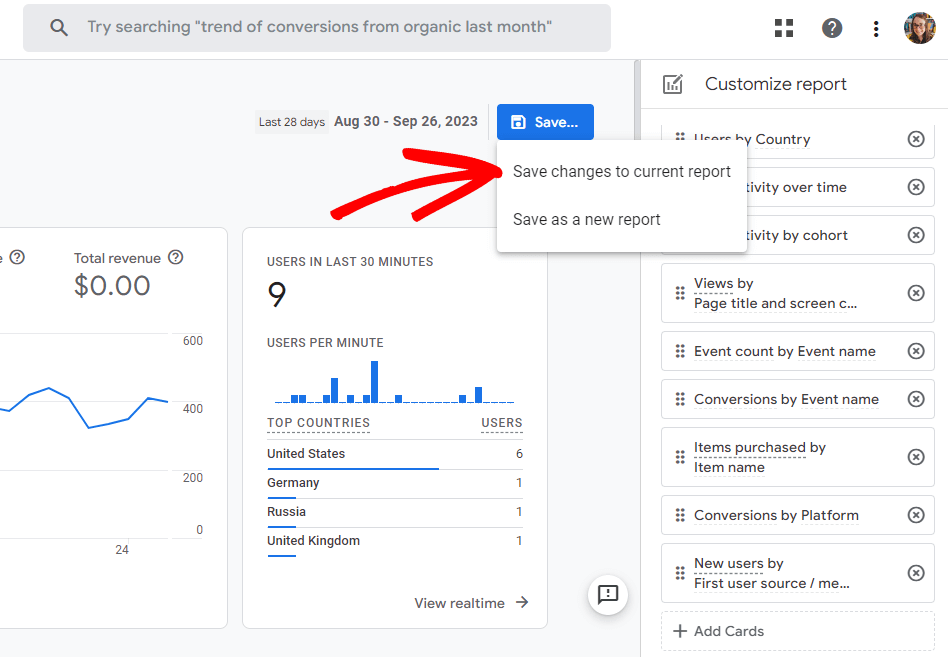
Step 6: Click the Save button. A dropdown will appear – choose Save changes to current report.
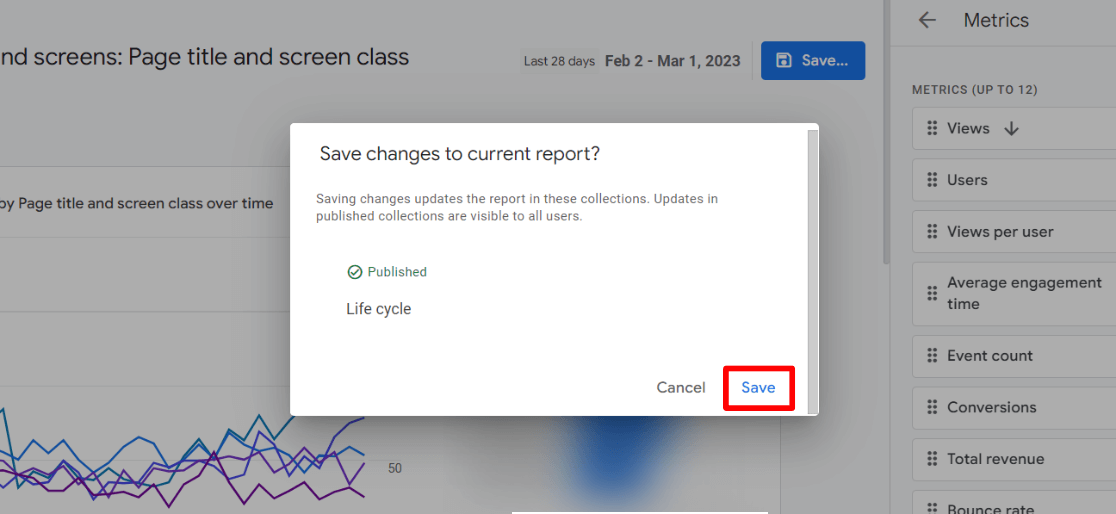
Step 7: A popup will appear asking if you’re sure you want to save your changes. Click Save.
That’s it! Exit the edit screen by clicking the Back arrow:

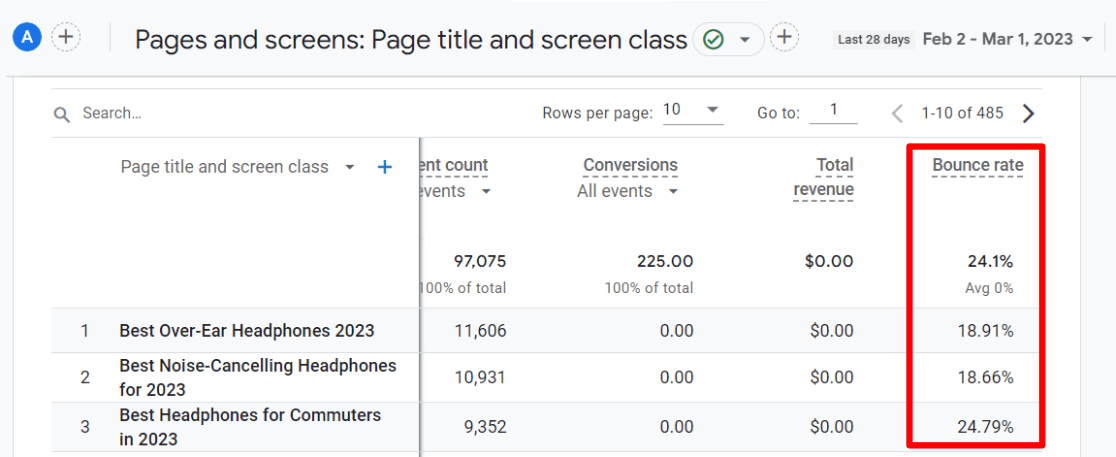
You can now scroll over in your Pages and screens table to view the bounce rate for each page.
Tracking Bounce Rate in WordPress
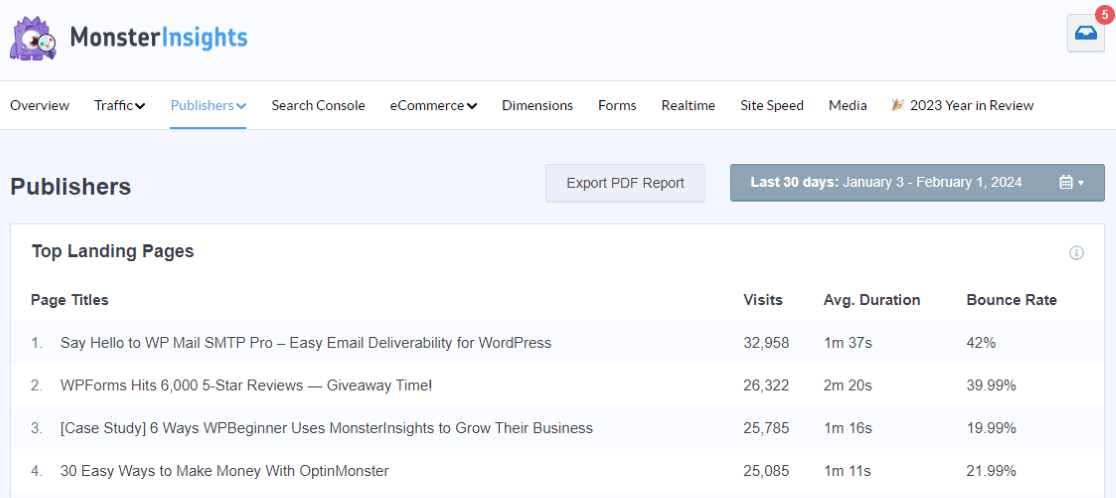
If you use WordPress, you can view your bounce rate directly inside your WordPress dashboard by installing MonsterInsights.
MonsterInsights is the best Google Analytics plugin for WordPress. Install it today to easily set up advanced Google Analytics tracking with a couple of clicks and add comprehensive reports right into your WordPress dashboard.
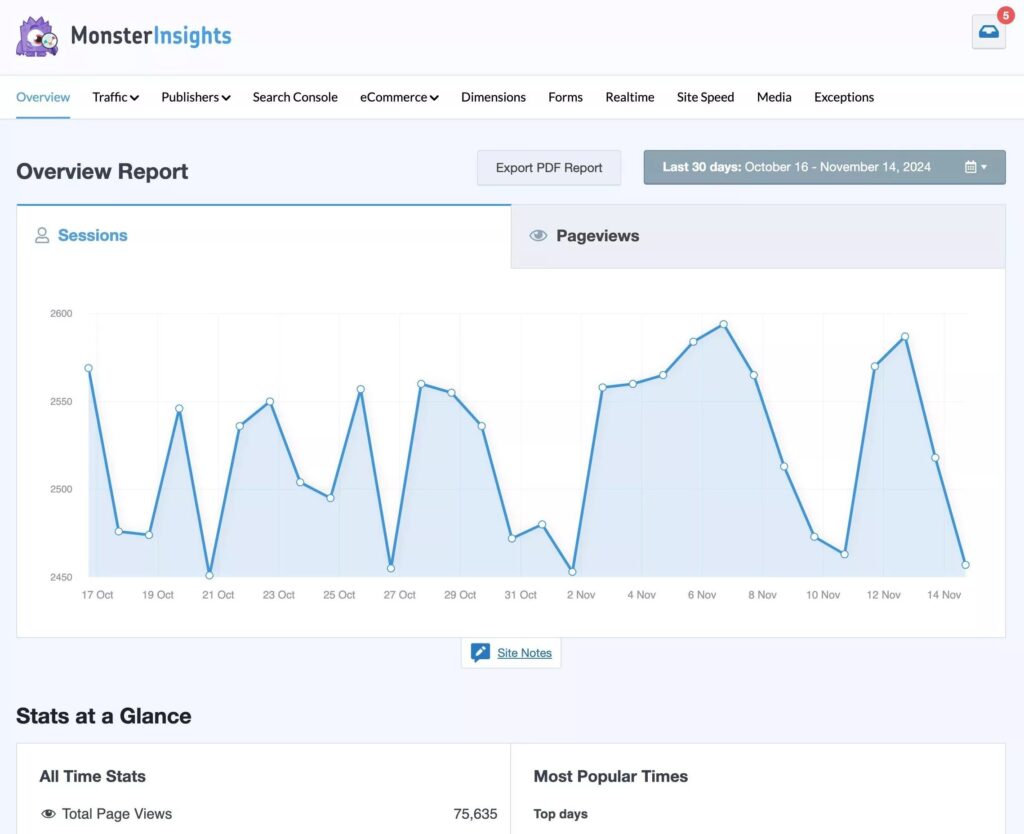
You’ll find bounce rate in several of your reports inside MonsterInsights. It’s included in the Social report:

In the Top Landing Pages report:
And more.
Get started with MonsterInsights now!
And that’s it!
I hope you liked this article on how to track your site’s bounce rate in Google Analytics. You might also like to check out:
9 Google Analytics SEO Hacks to Increase Search Traffic
How to Reduce Bounce Rate: 6 Simple, Proven Methods
Google Analytics 4 Segments: Beginner’s Guide
Digital Marketing Analytics: Beginner’s Guide
Not using MonsterInsights yet? What are you waiting for?
Finally, don’t forget to follow us on Facebook, and YouTube for more helpful reviews, tutorials, and Google Analytics tips.
Bounce Rate FAQ
What is website bounce rate?
Website bounce rate is the percentage of visitors who leave a site after viewing only one page for less than 10 seconds without interacting further. A high bounce rate may indicate poor user experience or irrelevant content. Reducing bounce rate involves improving page load speed, content relevance, and user engagement.
What is a good bounce rate on a website?
Honestly, there’s no such thing as a good bounce rate that works for all pages and every site. Different types of sites and different types of pages will differ in terms of what counts as a “good” bounce rate. Instead of worrying about an exact number, look at your pages that have the highest bounce rate and work on improving them.
What does a high bounce rate indicate?
A high bounce rate means you could most likely make some changes to your page to make it more engaging. Try updating your content, addressing site speed and technical issues, and adding interactive elements like buttons, forms, or links.
How do I find bounce rate in Google Analytics 4?
You’ll need to add bounce rate to your reports. To add it to your main reports, click the pencil icon in the upper right of the screen to edit the metrics shown in the table. Or, build your own custom explore report and include the bounce rate metric there.
What are the best alternate engagement metrics to watch?
Instead of bounce rate, better indications of engagement in Google Analytics include overall engagement time, engagement time per page, and engagement rate. To learn how to increase your engagement, check out 8 Proven Ways to Increase User Engagement on Your Website.

I was searching for a way to use the new Google Analytics interface. I wasn’t able to understand the Bounce Rate figures of my website until now.