Google Analytics 4 is new and can be confusing if you’re not sure what some of the new metrics and terms mean. So, we’ve created this Google Analytics 4 glossary to go over some of the things that have changed, and some of the new terms that have been introduced.
After our list of terms, we’ll go over an awesome way to simplify using GA4.
Let’s get right to it!
Video Walkthrough
Google Analytics 4 Glossary
- Attribution
- Automatically Collected Events
- Average Engagement Time
- Data Stream
- Default Reporting Entity
- Engaged Sessions
- Engagement Rate
- Engaged Sessions Per User
- Enhanced Measurement
- Events
- Event Count
- Event Parameter
- Explore
- Life Cycle
- Measurement ID
- Monetization
- Purchase
- Traffic Acquisition Report
- User Acquisition Report
Attribution
Attribution is all about how you choose to give credit to the various traffic channels for conversions on your site. For instance, if you’re using last click attribution, that means you’re giving credit to the last channel that was used to visit your site and complete a conversion.
So if someone visits your site via social media, then comes back later via organic search and completes a conversion, the organic visit will get credit for their conversion. If you change your attribution model to first click, then social media would get the credit.

Automatically Collected Events
Google Analytics 4 collects data for a list of events automatically. Since GA4 is events-based, it tracks some events out of the box. For web properties (not apps), those events include:
- page_view
- scroll
- session_start
- user_engagement
- video_complete
- video_progress
- video_start
- view_search_results
Average Engagement Time
Google Analytics 4 is very focused on engagement instead of bounce rate (which was a metric in Universal Analytics). Average engagement time replaces the average time on site metric from Universal Analytics. It just means how long on average users spent on your site.

For more on engagement in GA4, read Top 5 User Engagement Metrics for Your Website Explained.
Data Stream
Data stream refers to the stream of data coming in from your site to Analytics. Once you put a tracking code on your website or app, you get a data stream. Each property you create will have its own stream.

Default Reporting Entity
Default reporting entity refers to how you track and report on users. You can choose to track them by User ID, Google signals and device, or by device only. If you don’t set up User ID reporting or use Google Signals, then your entity will just be by device, no matter which option you choose.

Engaged Sessions
How many of your visitors are “engaged” with your site? Google Analytics will count a session as engaged if:
- It lasts longer than 10 seconds
- It includes at least one conversion
- It includes 2 or more page views
If you want the timing for engagement to be less or more than 10 seconds, you can adjust it by going to Admin » Data Streams » Your site’s stream » More tagging settings » Adjust session timeout.

Engagement Rate
Engagement rate in GA4 is the number of engaged sessions divided by the total number of sessions. So if you had 100 sessions and 67 of them were engaged, your engagement rate would be 67%.

Engaged Sessions Per User
This metric is simply the number of engaged sessions divided by the number of users. The higher the number, the more engaged your audience is.

Enhanced Measurement
Enhanced measurement refers to your ability in GA4 to turn on event tracking for certain common events without modifying your tracking code. This includes:
- Page views (turned on automatically)
- Scrolls to the bottom of a page
- Outbound link clicks
- Site searches
- Engagement with embedded YouTube videos
- File downloads

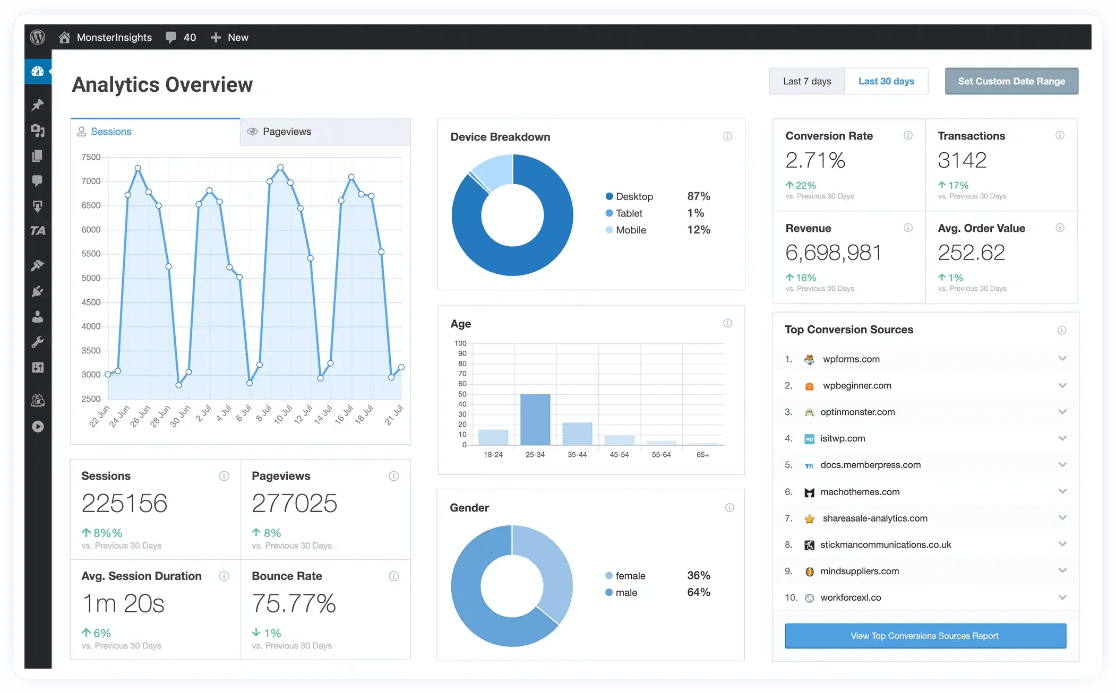
However, that doesn’t mean that reporting is easy for these optional events. You’ll have to create a custom report for more information on any of these events. That’s why we recommend using a plugin like MonsterInsights if you’re on WordPress!
Events
Universal Analytics had events too, but they’re totally different in GA4. Any engagement with your site is now called an event, including page views. In Universal Analytics, interactions were tracked as “hits”. Now they’re all events. GA4 has automatic, recommended, and custom events.

Event Count
This new GA4 metric shows the number of events that were tracked. It comes with a dropdown in some reports, so you can choose a specific event’s data to view in a table instead.

Event Parameter
An event parameter describes data that’s collected about the event. With a page view event, for example, the page title and page location (URL) are collected as parameters.
Explore
Google Analytics 4 has a new section called Explore for building custom reports (“Explorations”) and funnels using tables and graphs. When you create a custom report, you can choose a blank one to create a report from scratch, free form, a funnel visualization, or a path exploration.

Life Cycle
Life cycle is a new reporting section within GA4. It refers to where your users are at in their journey with your site, and it contains reports on user acquisition, engagement, monetization, and retention.

Measurement ID
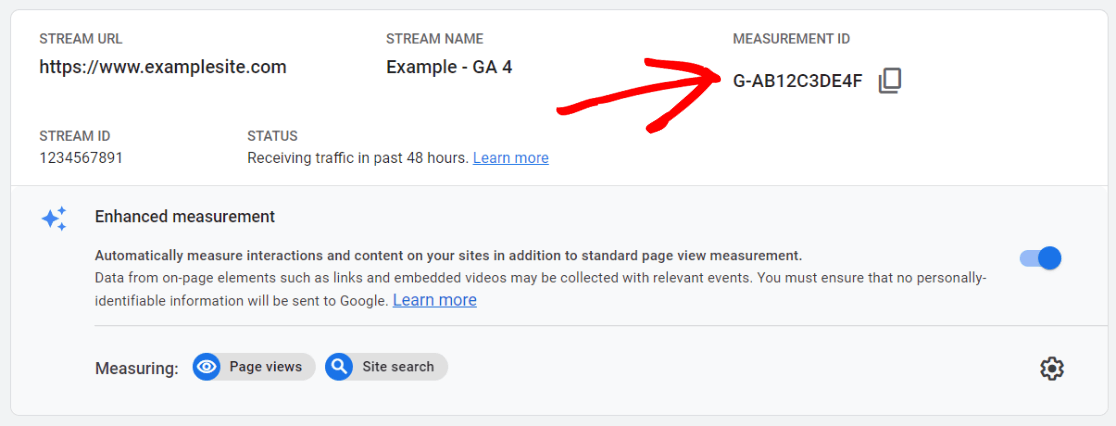
Instead of having a tracking ID like in Universal Analytics, in GA4 it’s referred to as your measurement ID. Each data stream has a unique measurement ID. It stars with “G-” then a series of letters and numbers.

Monetization
Instead of having eCommerce reports like in Universal Analytics, you have monetization reports in GA4. Under the Monetization heading, you have the following reports:
- Overview
- Ecommerce purchases
- In-app purchases
- Publisher ads

Purchase
Instead of transactions, GA4 tracks purchases. A purchase is recorded any time someone completes a purchase of a product or service on your website.

Traffic Acquisition Report
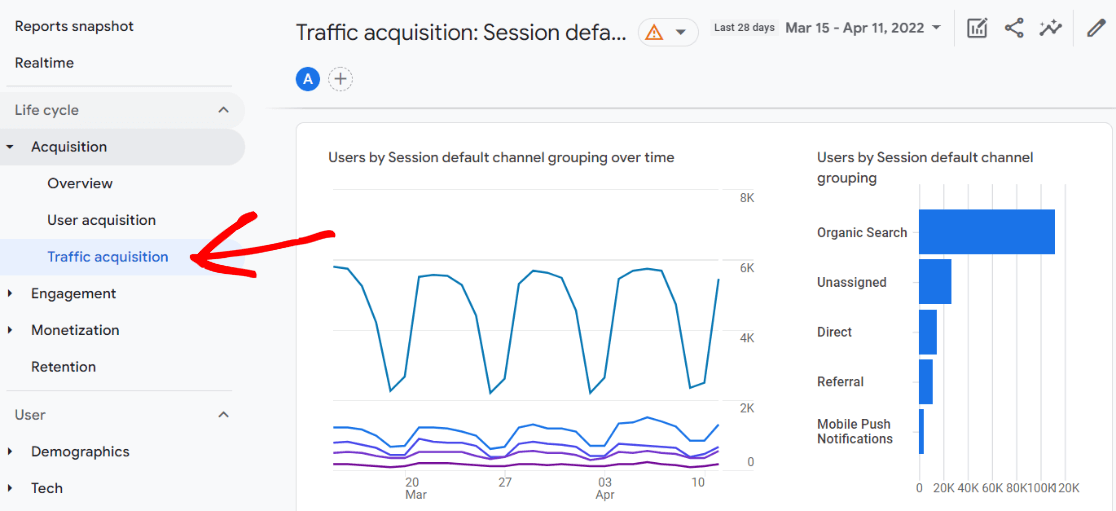
Under the Acquisition report heading, you’ll find the traffic acquisition report and the user acquisition report. The traffic acquisition report is about sessions, so you’ll see data about all sessions, whether the users are new or returning.

User Acquisition Report
Under the Acquisition report heading, you’ll find the traffic acquisition report and the user acquisition report. The user acquisition report provides data about how you attracted new users to your site.

Bonus: Simplify GA4 with MonsterInsights
If you’re a WordPress user, you’re in luck. Google Analytics 4 has a steep learning curve, but you can make it a whole lot easier by installing MonsterInsights.
MonsterInsights is the best Google Analytics plugin for WordPress. It allows you to easily connect your WordPress site with Google Analytics (both Universal Analytics and GA4), so you can view all the data that matters most right in your WordPress dashboard.

Plus, with the click of a button, you can set up sophisticated tracking features such as event tracking, eCommerce tracking, media tracking, form tracking, custom dimension tracking, outbound link tracking, and more.
While the Google Analytics 4 interface is changing a lot, MonsterInsights is staying simple and easy to read. It also sets up some of the complicated event tracking that comes with GA4 in just a couple clicks.
Learn more about MonsterInsights features and get started today!
That’s our Google Analytics 4 glossary. We hope it helped you on your quest to understand GA4 a little bit better.
For more on Google Analytics 4, check out:
Google Analytics 4 Goals: Why They’re Gone & How to Adapt
How to Set Up Google Analytics 4 eCommerce Tracking on WordPress
Universal Analytics Sunset: What it Means & What to Do Now
How to Add Google Analytics 4 to WordPress (Best Way)
And don’t forget to follow us on Twitter, Facebook and YouTube for more helpful Google Analytics tips.
