


Your store dashboard can tell you that revenue dropped last week. It can’t always tell you why.
Maybe a traffic source dried up, a product page stopped converting, or shoppers started leaving at the shipping step. Each cause needs a different fix, so the danger is guessing and fixing the wrong thing.
eCommerce analytics tools close the gap between what happened and why it happened. With proper analytics, you can track everything from total revenue and conversion rates to customer behavior and product performance.
No single tool answers every question, though. Some track revenue and traffic sources, while others show how shoppers use your pages, connect sales to your customer records, protect data privacy, or serve enterprise data teams.
In this guide, we compare 7 of the best eCommerce analytics tools by the question each one answers best. Whether you’re choosing a single tool or a pair that works together, you’ll see which option fits your store.
In This Article:
- How to Choose an eCommerce Analytics Tool
- A Quick Overview of the Best eCommerce Analytics Tools
- 7 Best eCommerce Analytics Tools
- 1. MonsterInsights — Best for WordPress and WooCommerce Stores
- 2. Google Analytics — Best Free Analytics Foundation
- 3. Mixpanel — Best for Event-Level Behavior Analysis
- 4. HubSpot — Best for Tying Store Analytics to Your CRM
- 5. Contentsquare (formerly Hotjar) — Best for Seeing Why Shoppers Drop Off
- 6. Matomo — Best for Privacy-First Data Ownership
- 7. Adobe Analytics — Best for Enterprise Retail Teams
- Which eCommerce Analytics Tool Should You Use?
- eCommerce Analytics Tools FAQs
How to Choose an eCommerce Analytics Tool
Picking an eCommerce analytics tool on its feature list alone could leave you paying for reports you never open, or missing the one number you needed. Here’s what to look for before you compare the tools below:
- Essential Features: Look for tools that track revenue, conversion rates, product performance, customer lifetime value, and sales funnels. Together, these metrics tell you how healthy your store is.
- Integration Capabilities: Your analytics tool should work with the platform your store runs on, whether that’s WooCommerce, Shopify, or another solution.
- Ease of Use: Complex dashboards won’t help if you can’t understand the data. Look for tools with clear, actionable insights that don’t require a data science degree.
- Privacy Compliance: With GDPR and other privacy laws in play, look for privacy features that protect customer data. No tool makes a store compliant by itself, so it’s worth checking how each one handles consent and where it stores data.
- Scalability: Pick tools that can grow with your business, from startup to enterprise level.
Once you know which of these matters most for your store, it’s easier to narrow down the tools below. If you need revenue reports inside WordPress, you’ll land on a different pick than if you need session replays or full data ownership.
Start With the Question
Each tool below is built to answer a different question, such as which channel brought in a sale or why shoppers left the checkout. Pairing a traffic-and-revenue tool with a behavior tool can answer both what happened and why.
A Quick Overview of the Best eCommerce Analytics Tools
Here’s a side-by-side look at the seven eCommerce analytics tools in this guide, including who each one suits, whether it has a free plan and what it costs to start. The full reviews follow the table.
| PRODUCT NAME | BEST FOR | FREE PLAN | STARTING PRICE |
|---|---|---|---|
| MonsterInsights | Best for WordPress and WooCommerce stores | Yes, MonsterInsights Lite | eCommerce on Pro, $199.50/year |
| Google Analytics | Best free analytics foundation | Yes | Free (Analytics 360 is the paid enterprise tier) |
| Mixpanel | Best for event-level behavior analysis | Yes, up to 1M events/month | Growth from $0, then usage-based |
| HubSpot | Best for tying store analytics to your CRM | Yes, free tools | Starter listed at $20/month per seat |
| Contentsquare (formerly Hotjar) | Best for seeing why shoppers drop off | Yes, up to 200k sessions/month | Growth $39/month billed yearly |
| Matomo | Best for privacy-first data ownership | Yes, self-hosted core | Cloud from US$26/month (excl. tax) |
| Adobe Analytics | Best for enterprise retail teams | No | Quote only |
7 Best eCommerce Analytics Tools
Each of the seven eCommerce analytics tools below is matched to the store question it answers best, from revenue and traffic to on-page behavior.
1. MonsterInsights — Best for WordPress and WooCommerce Stores

BEST FOR: WordPress store owners on WooCommerce or Easy Digital Downloads who want revenue data inside their dashboard
KEY FEATURES: eCommerce Report, 1-click Enhanced eCommerce Tracking, Funnel, Orders by Location, Spend by Day/Hour, Refunds, Refunds by Geo, Cart Abandonment, User Journeys, Charlie Chat
PRICING: Plus ($99.50/year) covers standard reports. eCommerce reports start on Pro at $199.50/year (introductory pricing; renews at $399).
FREE PLAN / TRIAL: Free MonsterInsights Lite on WordPress.org; 14-day money-back guarantee on paid plans
If your store runs on WordPress, MonsterInsights lets you see revenue, top products and the traffic sources behind each sale without leaving your dashboard. It’s a Google Analytics plugin for WordPress that sets up eCommerce tracking without any coding, on the Pro plan.
MonsterInsights turns Google Analytics data into simple, actionable reports right inside your WordPress dashboard. With Pro, you can see your most important eCommerce metrics at a glance, including revenue, conversion rates, top products, and traffic sources.
On Pro, MonsterInsights tracks product views, add-to-cart events, checkouts and revenue for WooCommerce, Easy Digital Downloads, MemberPress and other store platforms. It detects the platform and configures the tracking for you, then shows the results in your WordPress dashboard.
If you sell to customers in the EU, the EU Compliance addon adjusts your Google Analytics tracking to help you meet EU privacy rules.
The biggest draw of MonsterInsights is that it removes the technical setup. Instead of configuring Google Tag Manager yourself or hiring a developer, you can turn on eCommerce tracking from inside WordPress.
The eCommerce Report shows your conversion rate, total transactions, revenue, average order value, and top-selling products. It also shows which traffic sources bring in the most revenue, helping you identify your most profitable marketing channels.

MonsterInsights has also added five newer eCommerce reports: Orders by Location, Spend by Day, Spend by Hour, Refunds and Refunds by Geo. You can read about each one in our eCommerce reports announcement.
Those reports sit in the eCommerce menu alongside Funnel, Cart Abandonment, Coupons and User Journeys, all on Pro. Orders by Location, for example, shows which cities and countries make up your store’s sales in a panel headed Purchases by Geography.

When sales dip, the Funnel report shows where shoppers drop out between viewing a product, adding it to the cart and completing the purchase. It gives you a conversion rate for each stage, so you know which step to fix first.

If an order comes back, WooCommerce refund tracking on Pro records the refund so your revenue reflects returns. The Refunds report then shows which products get refunded most often.
On every plan, including the free Lite version, you can also ask Charlie Chat about your data by clicking the purple mascot icon in the bottom-right corner of your reports. Each answer comes with a recommended next step, and questions draw on a monthly credit allowance that grows with your plan.
MY TAKE
MonsterInsights is the pick when your store already runs on WordPress and you’d rather read revenue reports than build them. If you want heatmaps as well, I’d look at the Elite plan, which adds UserFeedback’s no-code heatmaps.
PROS
- WooCommerce and Easy Digital Downloads tracking sets up without code on Pro
- Revenue, top products and top-earning traffic sources inside the WordPress dashboard
- Dedicated reports for sales by location, sales by day and hour, refunds and checkout drop-off
- Free Lite version and a 14-day money-back guarantee on paid plans
CONS
- eCommerce reports require the Pro plan or higher
- Designed for WordPress sites, so stores on other platforms need a different tool
- Introductory pricing renews at the full price
Get started with MonsterInsights today!
2. Google Analytics — Best Free Analytics Foundation

BEST FOR: Store owners who want a free, full-featured analytics foundation
KEY FEATURES: Ecommerce events, revenue and product reports, attribution reports, audience insights, custom reports and explorations, Google Ads linking
PRICING: Free. Google also sells an enterprise tier, Analytics 360.
FREE PLAN / TRIAL: Yes, the standard version is free
Google Analytics gives you a free view of where your sales come from and what shoppers do before they buy. Google keeps updating it, and its reports go into detail on your store’s performance.
With Google Analytics, you can track total revenue, conversion rates, average order value and product performance. You can also see ad cost and return on ad spend once you link Google Ads or import cost data.
Those numbers live under Monetization in the left-hand menu. The overview shows total revenue and purchasers, and the Ecommerce purchases, Purchase journey and Checkout journey reports sit beneath it.

Google Analytics can also show the path a shopper takes from their first visit to their final purchase. Its ecommerce events track product views, add-to-carts, checkout steps, purchases and refunds, and its attribution reports show which marketing channel gets credit for each sale.
Beyond sales data, you can study customer demographics and build custom reports and explorations around the KPIs that matter most to your store. It works on any store you can add a Google tag to.
The main challenge with Google Analytics is its complexity. The learning curve can be steep, especially for beginners who just want to see basic sales data without diving into advanced configurations.
For WordPress stores, MonsterInsights puts Google Analytics’ ecommerce data inside your dashboard and sets up WooCommerce and EDD eCommerce tracking without code, on Pro.
MY TAKE
Google Analytics trades a steeper learning curve for a price tag of zero. My approach would be to treat it as the foundation for any store and add other tools only when a question goes unanswered.
PROS
- The standard version is free
- Ecommerce events cover the path from product view to purchase and refund
- Links to Google Ads for ad cost and return on ad spend
- Works on any store platform that can load a Google tag
CONS
- Steep learning curve for beginners
- Ecommerce events need setup through code, Google Tag Manager or a plugin
- Finding the right report can take time
Get started with Google Analytics today!
3. Mixpanel — Best for Event-Level Behavior Analysis

BEST FOR: Store owners who want to study which shopper actions lead to purchases and repeat visits
KEY FEATURES: Event tracking, funnels, retention and cohort analysis, experiments and feature flags, session replay, user segmentation
PRICING: Growth starts at $0: the first 1 million events are free, then pricing scales with event volume. Enterprise is quote-based.
FREE PLAN / TRIAL: Free plan covers up to 1 million events a month with unlimited seats
Mixpanel is a product analytics platform for store owners who want to understand shopper behavior in detail.
Mixpanel tracks events, just as Google Analytics does. The difference is focus: Mixpanel is designed to show which actions shoppers take, and in what order, before they buy or come back. That makes it useful for seeing how customers interact with your products and which behaviors lead to purchases or churn (customers who stop coming back).
For a store, that means tracking actions such as product searches, wishlist additions and checkout steps, then lining them up in a conversion funnel to see where shoppers drop off. Cohort reports follow customer retention and lifetime value over time, and you can segment any of it by customer type, traffic source or other attributes.
Mixpanel’s Experiments tool also runs A/B tests and feature-flag rollouts, so you can test a change and measure its effect in the same place.
Mixpanel excels when you need to answer questions like “Which product features lead to more purchases?” or “How do customer behaviors differ between mobile and desktop users?”
Mixpanel asks more of you up front, though. It requires more setup and technical knowledge than plug-and-play solutions.
Our comparison of Mixpanel and Google Analytics goes deeper on how they differ.
MY TAKE
Mixpanel stands out for how closely it follows the sequence of actions a shopper takes before buying or leaving. It’s the one I’d pick when someone on your team has time to plan events and build reports.
PROS
- Free plan covers up to 1 million events a month with unlimited seats
- Experiments and feature flags are included on the Free and Growth plans
- Detailed funnel, retention and cohort analysis
- Usage-based Growth pricing starts at $0
CONS
- More setup and technical knowledge than plug-and-play tools
- Growth plan costs rise with event volume
- Reports take time to learn
Get started with Mixpanel today!
4. HubSpot — Best for Tying Store Analytics to Your CRM

BEST FOR: Store owners who want sales and marketing data connected to customer records in a CRM
KEY FEATURES: Free CRM, marketing analytics, lead scoring, email and marketing automation, plus multi-touch revenue attribution and customer journey analytics on Marketing Hub Enterprise
PRICING: Marketing Hub Starter is priced per seat, listed at $20/month per seat (a limited-time new-customer discount was running when we checked). Professional starts at $800/month plus a $3,000 one-time onboarding fee. Enterprise starts at $3,600/month.
FREE PLAN / TRIAL: HubSpot’s free tools include basic marketing analytics
HubSpot is built for store owners who want their analytics and customer records in the same place. It offers a suite of marketing, sales, and analytics tools for teams focused on inbound marketing (drawing customers in with content and email) and customer relationship management (CRM).
HubSpot is less focused on deep analysis than dedicated analytics platforms; its strength lies in connecting your analytics to your entire customer lifecycle. You can see how website visitors become leads, then customers, and track their ongoing engagement.
HubSpot’s lead scoring helps you identify your most valuable prospects, and its marketing reports calculate the return on your marketing investments. It also connects with major eCommerce platforms.
The deeper reporting sits on Marketing Hub Enterprise. That tier adds multi-touch revenue attribution, which tracks the marketing efforts that drive sales, and customer journey analytics, which shows the path from visitor to customer.
HubSpot works best if you want to combine analytics with marketing automation, email campaigns, and CRM functionality. It’s an all-in-one platform rather than a specialized analytics tool.
MY TAKE
HubSpot makes the most sense when you want email, marketing and customer records in one place. I’d choose it for the CRM and treat its analytics as a useful extra.
PROS
- Free CRM and basic marketing analytics
- Ties website visits to leads and customers
- Marketing automation and email in the same platform
CONS
- Multi-touch attribution and journey analytics sit on Enterprise, from $3,600/month
- Professional adds a $3,000 one-time onboarding fee
- Less focused on detailed store analytics than dedicated tools
Get started with HubSpot today!
5. Contentsquare (formerly Hotjar) — Best for Seeing Why Shoppers Drop Off

BEST FOR: Store owners who want to see how shoppers use their product and checkout pages
KEY FEATURES: Heatmaps and attention maps, session replay, funnels, surveys and feedback, error monitoring, Sense AI summaries (Growth plan)
PRICING: Experience Analytics Growth is $39/month billed yearly ($49 month-to-month)
FREE PLAN / TRIAL: Free plan covers up to 200k sessions a month, with no credit card required
Contentsquare shows you how visitors actually use your store, through heatmaps, session replays, and user feedback tools.
If you came here looking for Hotjar, you’re in the right place. Hotjar is now part of Contentsquare, and new users sign up for the tools on Contentsquare.
Contentsquare’s visual approach shows what shoppers experience on the page, not just the result. Instead of only seeing that people abandon their carts, you can watch recordings of actual sessions to understand why they’re leaving.
Heatmaps and attention maps show where shoppers click, scroll and pay attention on your product pages, and session replays let you watch real sessions to find friction points. Funnels show where shoppers drop out of your checkout, and error monitoring catches JavaScript errors that could get in the way of a purchase.
To hear from shoppers directly, you can ask them about their experience with Surveys & Feedback. On the Growth plan, Sense AI summarizes heatmaps and replays, and Sense Chat answers questions about your data.
Contentsquare is well suited to finding user experience issues that traffic and revenue reports might miss. It’s especially useful for improving product pages, checkout flows, and mobile experiences.
If you’d rather compare other behavior tools first, our roundup of Hotjar alternatives for WordPress covers the options.
MY TAKE
Contentsquare is built around the “why” behind a drop-off, which makes it a natural partner for a revenue-focused tool. Once you know which page is losing sales, it’s the tool I’d add to see what shoppers do there.
PROS
- Free plan covers up to 200k sessions a month
- Heatmaps, session replays, funnels and surveys in one place
- Existing Hotjar users can still log in
- AI summaries on Growth can save you from watching every replay
CONS
- Revenue goals and tracking start on the quote-based Pro plan
- AI features need the paid Growth plan
- Older Hotjar tutorials may not match the current product names and plans
Get started with Contentsquare today!
6. Matomo — Best for Privacy-First Data Ownership

BEST FOR: Store owners who want to own their analytics data and control where it’s stored
KEY FEATURES: eCommerce tracking, goals, funnels, real-time reports, custom dimensions, cookieless tracking option
PRICING: Matomo Cloud starts at US$26/month (excl. tax) for 50,000 hits, with two months free on annual billing. The self-hosted On-Premise core is free, and premium features come as paid plugins.
FREE PLAN / TRIAL: Free self-hosted core; free Cloud trial with no credit card
Matomo is a privacy-focused Google Analytics alternative for store owners who want to own their data and control where it’s stored.
Unlike Google Analytics, Matomo gives you 100% ownership of your data. You can host it yourself or use Matomo Cloud, and either way your customer data isn’t shared with third parties.
Matomo can be configured to track without cookies, and in some EU countries a tightly configured setup qualifies for a consent exemption. Matomo itself recommends treating JavaScript tracking as needing consent, though.
For store reporting, real-time reports show sales and visitor data as it happens, and goal tracking monitors conversions and revenue attribution. Custom dimensions let you track the eCommerce metrics specific to your store.
Matomo suits store owners in regulated industries and anyone who puts customer privacy first. The trade-off is cost or effort: Cloud is paid, and self-hosting means you run the server.
If you’re weighing Matomo against Google Analytics, our side-by-side comparison of the two breaks down the differences.
MY TAKE
If keeping full control of your customer data is a top priority, Matomo is the strongest fit on this list. Before choosing a version, I’d weigh the Cloud price against the time a self-hosted server takes.
PROS
- 100% data ownership on every hosting option
- Free self-hosted On-Premise core
- Option to track without cookies
- Free Cloud trial with no credit card
CONS
- Consent may still be needed, depending on your setup and country
- Cloud pricing scales with your monthly hits
- Self-hosting needs server skills, and some premium features are paid plugins
Get started with Matomo today!
7. Adobe Analytics — Best for Enterprise Retail Teams
BEST FOR: Enterprise analytics teams at large retailers with complex reporting needs
KEY FEATURES: Analysis Workspace, multi-touch attribution, predictive analytics, real-time segmentation, custom variables, enterprise integrations
PRICING: Adobe doesn’t publish Adobe Analytics pricing. You get a quote by booking a demo.
FREE PLAN / TRIAL: No free plan is listed; access starts with a demo
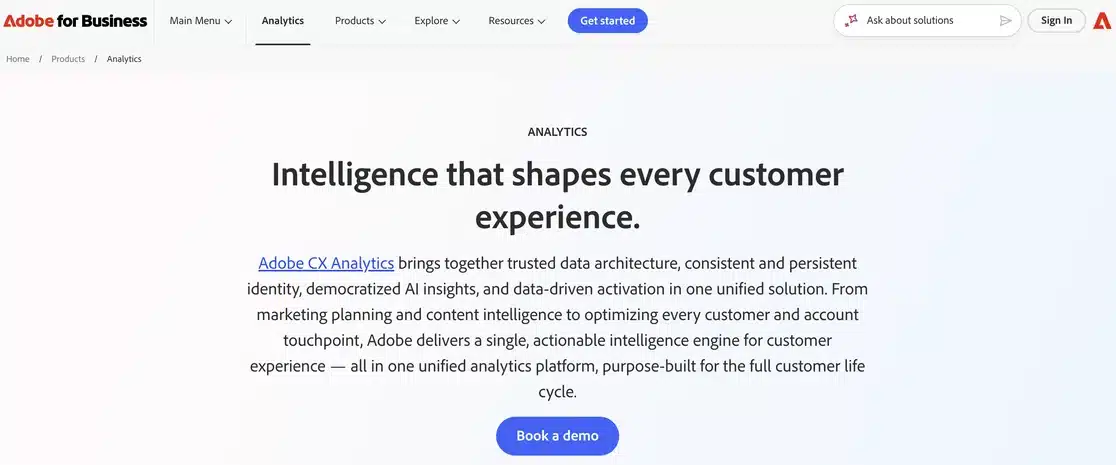
Adobe Analytics gives the data teams at large retailers a way to analyze complex customer data across channels. Adobe now markets it under its Adobe CX Analytics umbrella.

Adobe Analytics offers advanced segmentation, attribution modeling, and predictive analytics. It’s built for analysts who work with large amounts of data and need custom reporting.
Adobe’s multi-touch attribution covers every marketing channel, and its predictive analytics use AI to surface insights and forecasts. You can build customer segments that update in real time and track your own metrics and dimensions with custom variables. Adobe Analytics also connects with major enterprise software systems.
Adobe Analytics is designed for dedicated analytics teams with complex reporting requirements. If you don’t have a dedicated analytics team, Adobe’s setup and cost could outweigh what you’d use.
MY TAKE
Adobe Analytics makes sense at a scale where analysts, not store owners, run the reports. For a small or midsize store, I’d start with one of the options above and revisit Adobe if your reporting needs grow past them.
PROS
- Advanced attribution and segmentation
- Analysis Workspace for custom, in-depth reports
- Connects with major enterprise software systems
CONS
- No published pricing
- Needs a dedicated analytics team to use fully
- Setup is a larger project than plug-and-play tools
Which eCommerce Analytics Tool Should You Use?
The best eCommerce analytics tool for your store depends on the question you most need answered, your technical comfort, and your budget.
- If you run your store on WordPress (WooCommerce or EDD) and want revenue data without leaving your dashboard: MonsterInsights Pro is the pick. It sets up eCommerce tracking without code and shows revenue, top products and top-earning traffic sources inside WordPress.
- If you want a free foundation that works on any store platform: Google Analytics gives you ecommerce events, revenue and attribution reports at no cost. It does take time to learn.
- If you want to study the actions that lead shoppers to buy or come back: Mixpanel offers detailed funnel, retention and cohort analysis. Its Free plan covers up to 1 million events a month.
- If your sales and marketing already run through a CRM: HubSpot connects website visits to leads and customers, with multi-touch revenue attribution on Marketing Hub Enterprise.
- If you know where shoppers drop off but not why: Contentsquare (formerly Hotjar) shows heatmaps and session replays of those pages. Its Free plan covers up to 200k sessions a month.
- If data ownership and privacy are your top priorities: Matomo gives you 100% ownership of your data, with a choice of Cloud hosting or a free self-hosted core.
- If you have a dedicated analytics team and enterprise-scale data: Adobe Analytics offers advanced segmentation, attribution and custom reporting, priced by quote.
Two of these tools can also work as a pair, with one showing what happened and the other showing why. For example, Google Analytics could show that checkout conversions dropped, and Contentsquare’s session replays could show what shoppers ran into.
The key is starting with a solid foundation of analytics and then adding specialized tools as your business grows and your needs become more sophisticated.
See Which Products and Channels Make You Money
MonsterInsights shows your revenue, top products and best-earning traffic sources right inside WordPress, with WooCommerce and EDD tracking set up in one click. eCommerce reports are on MonsterInsights Pro.
See MonsterInsights Pro PlanseCommerce Analytics Tools FAQs
What are eCommerce analytics tools?
eCommerce analytics tools are software platforms that track and analyze data about your online store’s performance. They monitor metrics like sales revenue, conversion rates, customer behavior, product performance, and marketing campaign effectiveness to help you make data-driven decisions.
Is Google Analytics good for eCommerce tracking?
Yes. Google Analytics tracks ecommerce events such as product views, add-to-carts, checkouts, purchases and refunds, and it reports revenue and average order value. Those events need to be set up on your store first, through code, Google Tag Manager or a plugin.
Which analytics tool is best for small eCommerce businesses?
For small eCommerce stores on WordPress, Google Analytics combined with MonsterInsights offers strong value. Google Analytics is free, and MonsterInsights Pro sets up eCommerce tracking and shows the reports inside WordPress. Stores on other platforms can start with Google Analytics on its own.
How much do eCommerce analytics tools cost?
Costs vary widely. Google Analytics is free, and MonsterInsights eCommerce tracking starts on Pro at $199.50/year (introductory). Mixpanel and Contentsquare both have free plans, and Matomo Cloud starts at US$26/month.
HubSpot’s Marketing Hub Starter is listed at $20/month per seat. Adobe Analytics doesn’t publish pricing, so you get a quote by booking a demo.
Do I need multiple analytics tools?
Not always. One tool can cover your most pressing question, and a second is worth adding when it answers something the first can’t. One pairing to consider is Google Analytics for revenue and traffic, plus Contentsquare (formerly Hotjar) for on-page behavior. If email drives a lot of your sales, a CRM such as HubSpot can connect those sales to contact records.
Is Hotjar still available?
Hotjar is now part of Contentsquare, and hotjar.com redirects to Contentsquare’s site. New Hotjar accounts can no longer be created, so new users sign up for Contentsquare, whose Free plan includes the heatmaps, recordings and surveys Hotjar was known for. Existing Hotjar users can still log in.
What eCommerce metrics should I track?
Essential eCommerce metrics include total revenue, conversion rate, average order value, customer acquisition cost, customer lifetime value, cart abandonment rate, and return on ad spend (ROAS). Start with these basics and add more sophisticated metrics as your business grows.
That’s it! I hope this article helped you find the eCommerce analytics tools that answer your store’s biggest questions. If you liked this article, check out the following beginner-friendly guides:
- How to Set Up WooCommerce Google Analytics Tracking
- WooCommerce Conversion Tracking: Complete Guide
- Best WooCommerce Analytics and Reporting Plugins
- eCommerce Customer Journey Analytics: WordPress Guide
- How to Track Shopping Cart Abandonment With Google Analytics
Follow us on Twitter, Facebook, and YouTube for more Google Analytics tips.