Does your website offer the best experience possible for your visitors? There’s a Google Analytics 4 behavior flow report that can help you find out where you might be dropping the user experience ball: the path exploration report. Visualize your users’ path through your website by analyzing the GA4 path exploration report (this report was called the users flow report in Universal Analytics).
In this article, we’ll show you how to conduct a Google Analytics 4 behavior flow analysis, so you can deliver a smooth and seamless website experience to your users.
Google Analytics 4 Behavior Flow: Video Tutorial
What is Google Analytics 4 Behavior Flow?
The GA4 path exploration report visualizes your users’ path through your site. It helps you understand the behavior of your users, how they interact with your website, and where you might be able to make improvements to your user experience.

It works by letting you highlight the traffic through different events and pages, so you can see the flow of your traffic across your site.
Using the path exploration report, you can:
- Understand where your users are most likely to go next when they’re on certain pages
- See what pages caused people to hit the “back” button
- See how many users continued from one page to the next, and how many left
- And more
For example, if you have a product landing page on your site, you can analyze the exact steps users go through to land on that page and complete the checkout process.
Google Analytics Behavior Flow Tutorial
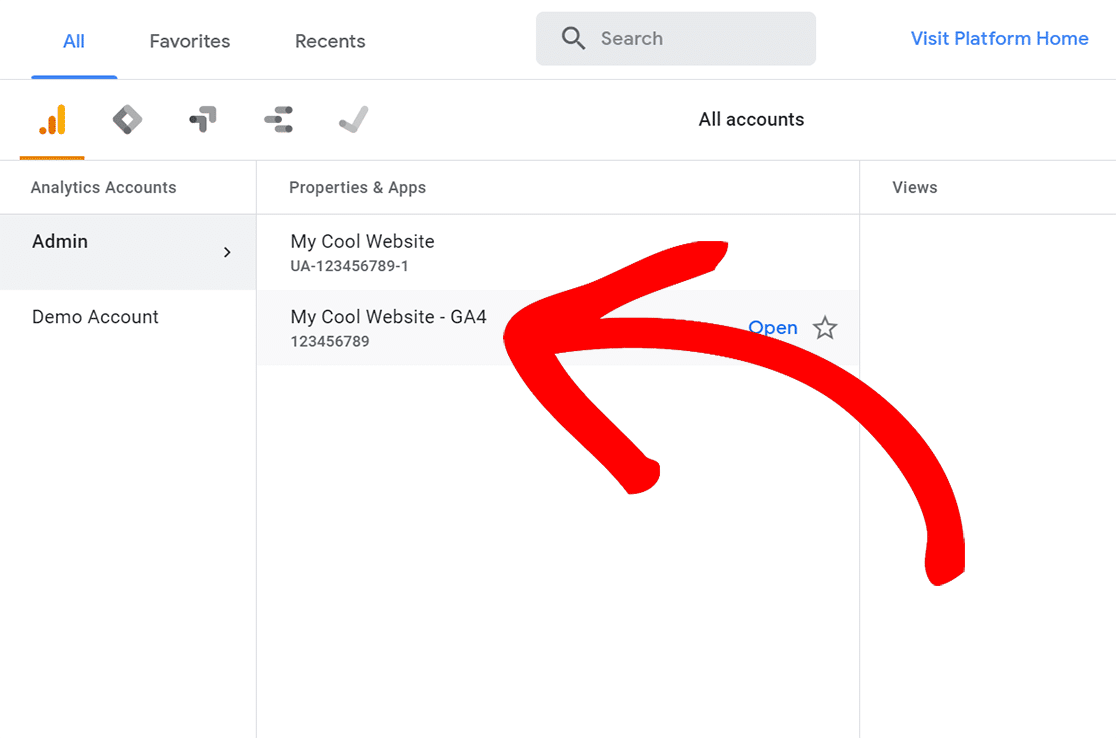
The first thing to do is to sign in to your Google Analytics account and select the website for which you’d like to conduct a user flow analysis.

To create the path exploration report, go to the Explore tab and choose the Path exploration template:

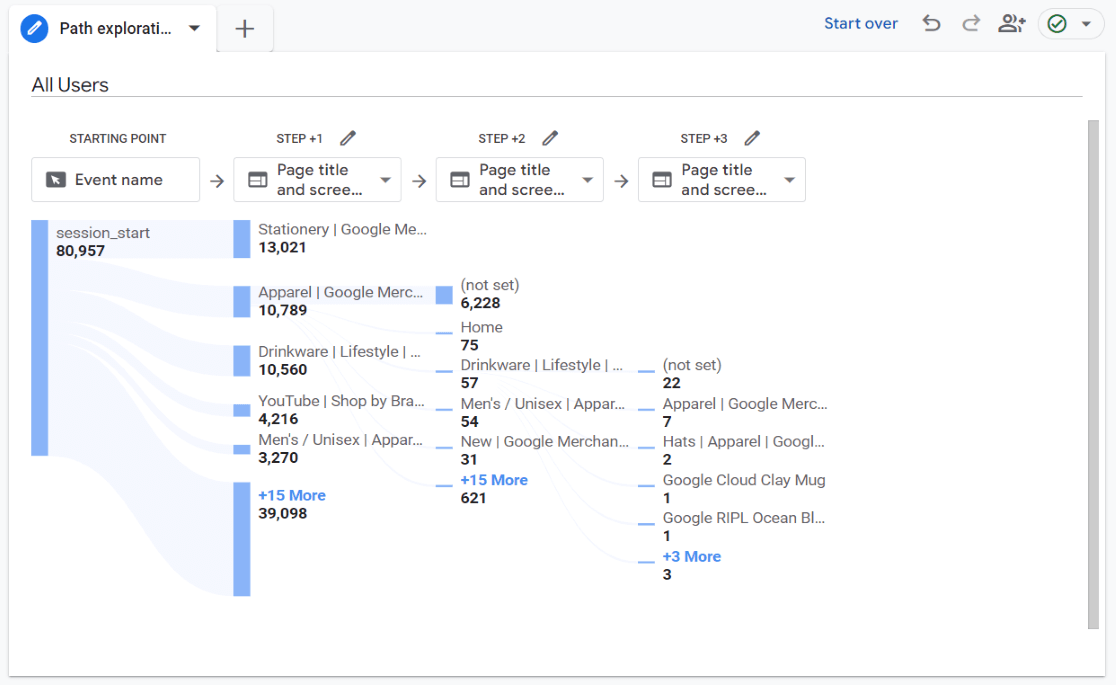
When you click on the template, Google will go ahead and create the path exploration report for you. It’ll look something like this:

In this report, you’ll see that it defaults to showing you a flow using events. It might look confusing at this point, but don’t worry! We’re going to change it.
Go ahead and click on the dropdown in Step 1 and choose one of the Page title options:

Now, you can start clicking on pages to see where your users went next. When you click on a page, another step will open up with the pages that your users visited after that page.

So, create the path exploration report and start clicking around to get the hang of how to use it.
GA4 Path Exploration Report FAQ
What is the path exploration report in GA4?
The page exploration report is a report that shows you how your users flow through your site, where they get stuck, and where they most commonly go next after visiting a page.
Is there a user flow report in GA4?
Yes, but it has some differences and is now called the path exploration report.
How do you set up path exploration in GA4?
- Open the Explore tab
- Click on the Path exploration template
- Change your Step 1 dropdown to a Page title option
Does the path exploration report show conversion paths?
It sort of does but there’s a better report for that: in the Advertising tab, go to Attribution » Conversion paths.
That’s it!
Are you using WordPress and have an eCommerce site? Make sure to check out the MonsterInsights User Journey report.
And don’t forget to follow us on Twitter, Facebook and YouTube for more helpful Google Analytics tips and tutorials.
