Are you having a hard time finding your Custom Dimension reports in Google Analytics? Follow this guide to create a custom report.
View Custom Dimensions in Google Analytics
Before you can view Custom Dimensions data in your Google Analytics reports, you’ll need to set up custom dimensions in MonsterInsights first and wait for 48 hours before you can see data.
You will see a value of “not set” for a custom dimension during the first 48 hours.
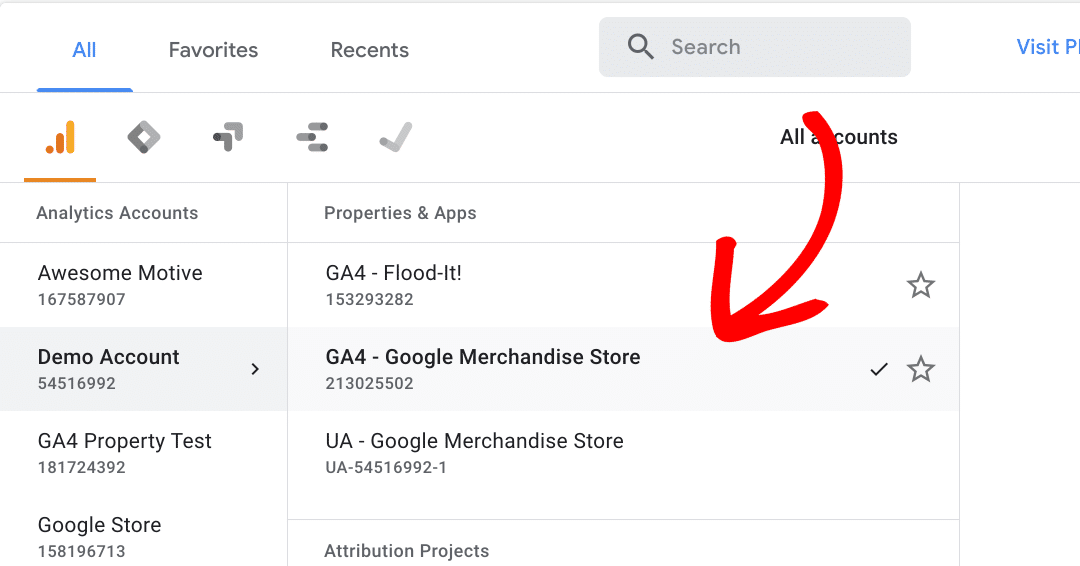
Once you’ve waited for enough time, go to analytics.google.com and make sure the correct property is active

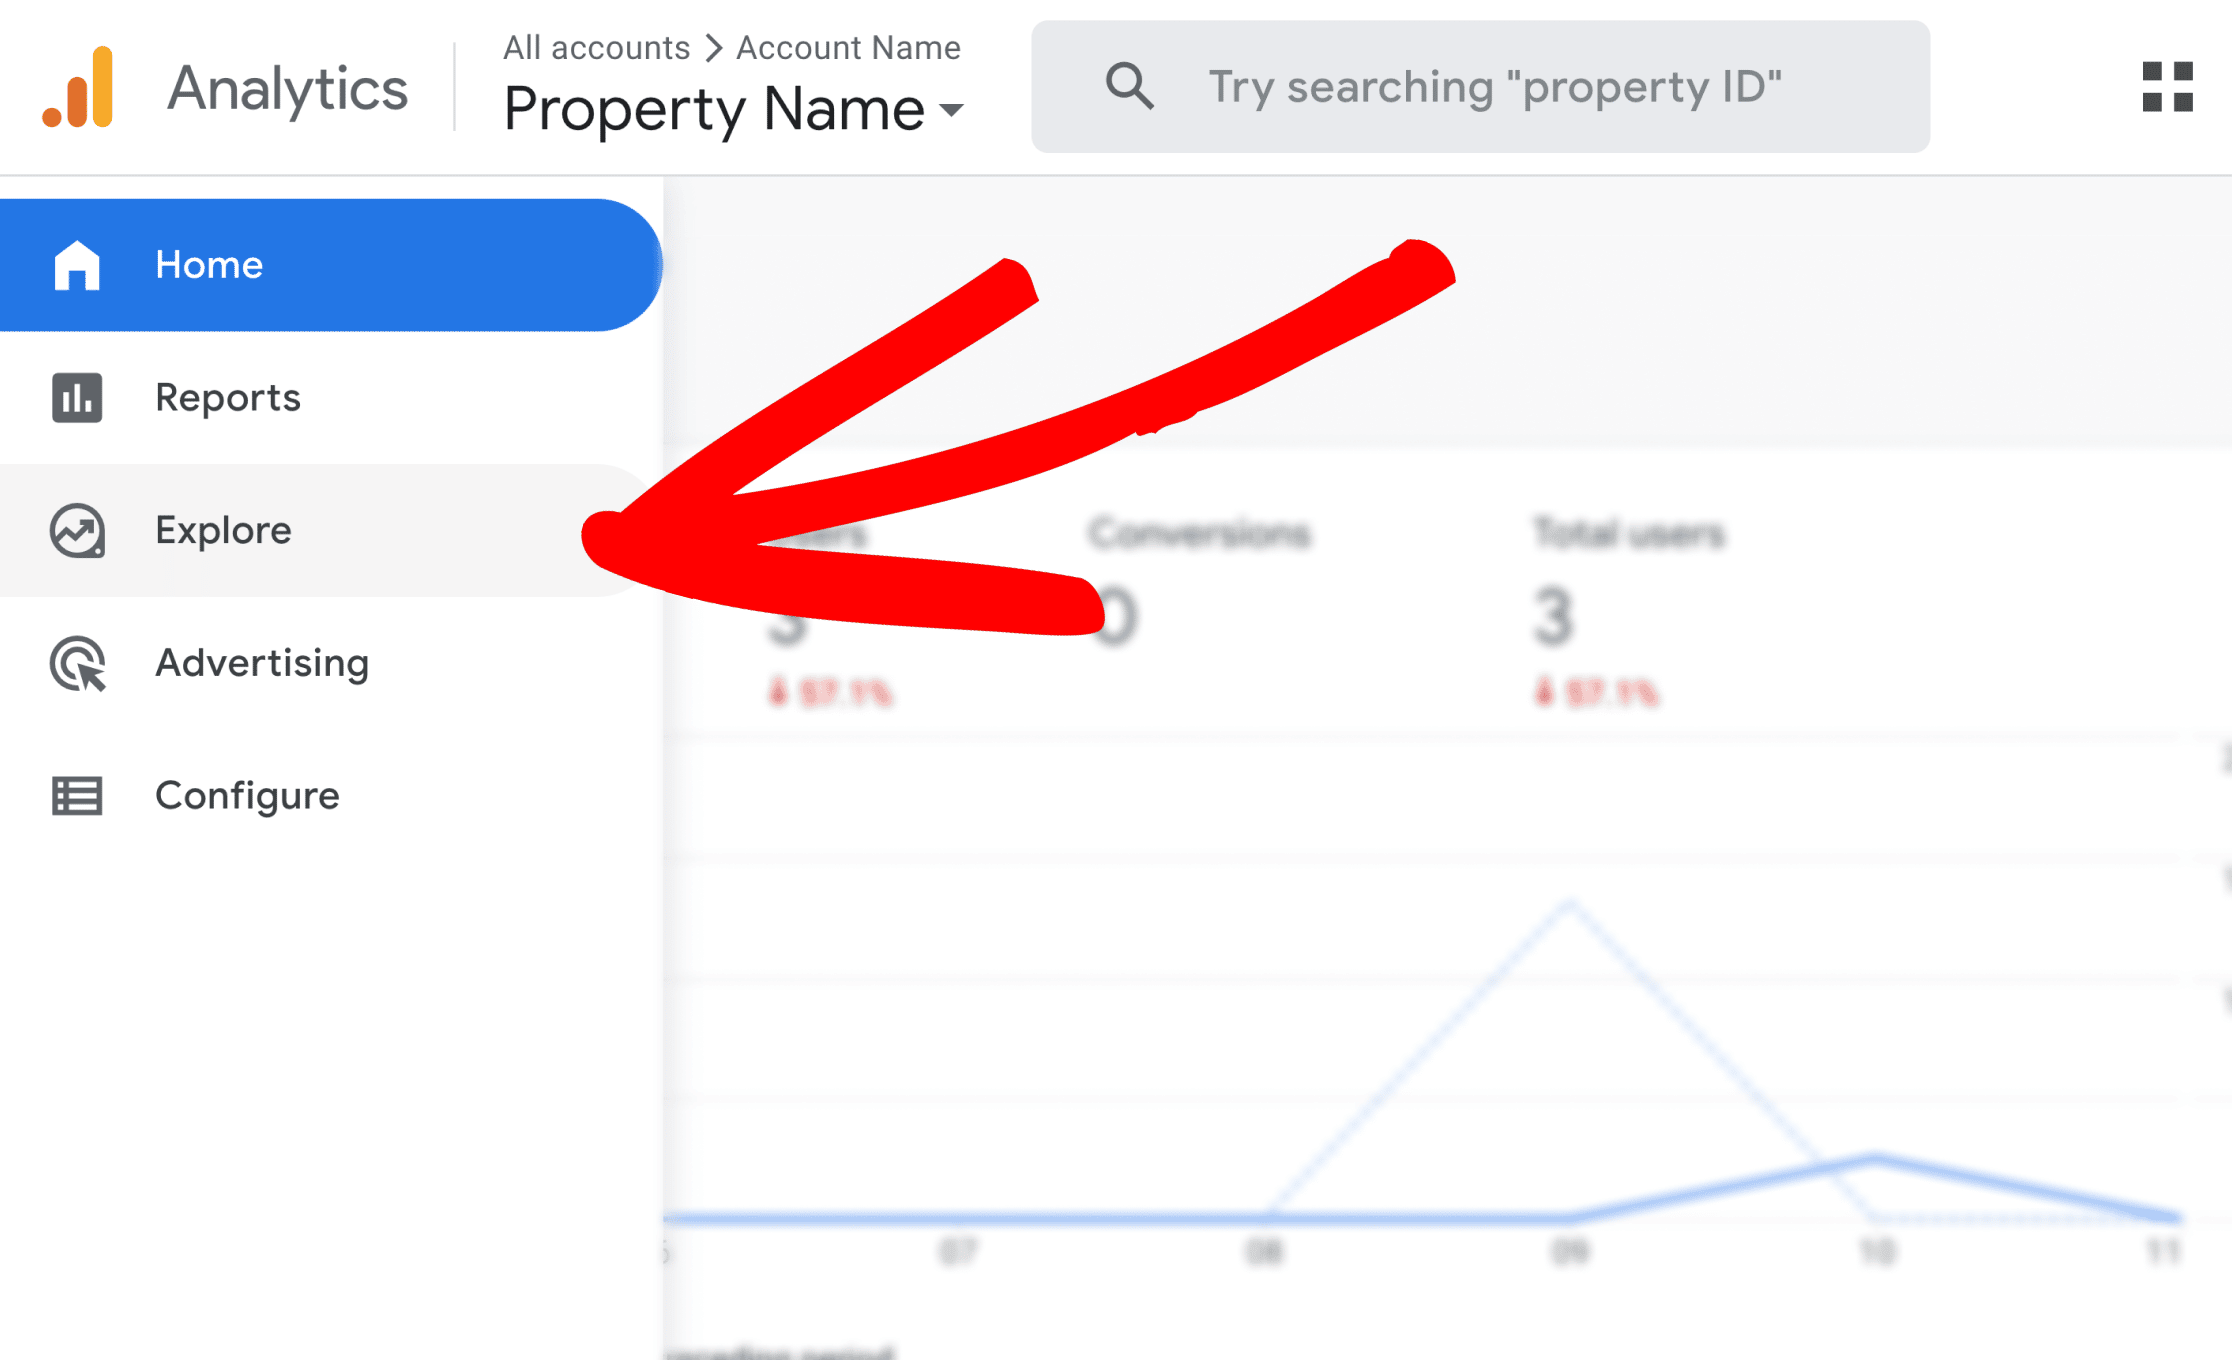
Next, visit the Explore page to create a new exploration. Creating a custom exploration allows you to mix and match the dimensions and metrics as needed in a report:

To get started, you can choose a template to work with. In this example, we’ll create a Blank template:

Next, add dimensions and metrics by clicking on the plus “+” icons under the Variables column.
Search for your custom dimensions in the search bar, select them, then click Import. Once done, drag dimensions into the Rows section within the Tab Settings.

Next, search for your metrics, such as Sessions or Pageviews, select them, then click Import. Once done, drag metrics into the Values section within the Tab Settings.

You should begin seeing data in the custom report.
Experiment with different combinations of dimensions and metrics as needed, to get the data you’re looking for.

To learn more in-depth about custom explorations, please see our guide here: How to Create Google Analytics Custom Reports (Step by Step)

