Are you interested in monitoring activity as soon as it happens on your website?
You can, with the Realtime reports dashboard in Google Analytics: the dashboard is updated continuously, and each user action is updated a few minutes after they occur.
This document will show you how you can use the Realtime report.
While following this guide, if you’re having trouble seeing yourself in the Realtime reports, please refer to this guide: Here’s the top reasons why you might not be seeing yourself.
This article will cover the following topics:
How to Find Realtime Reports in Google Analytics
Step 1: Sign in to Google Analytics at: analytics.google.com.
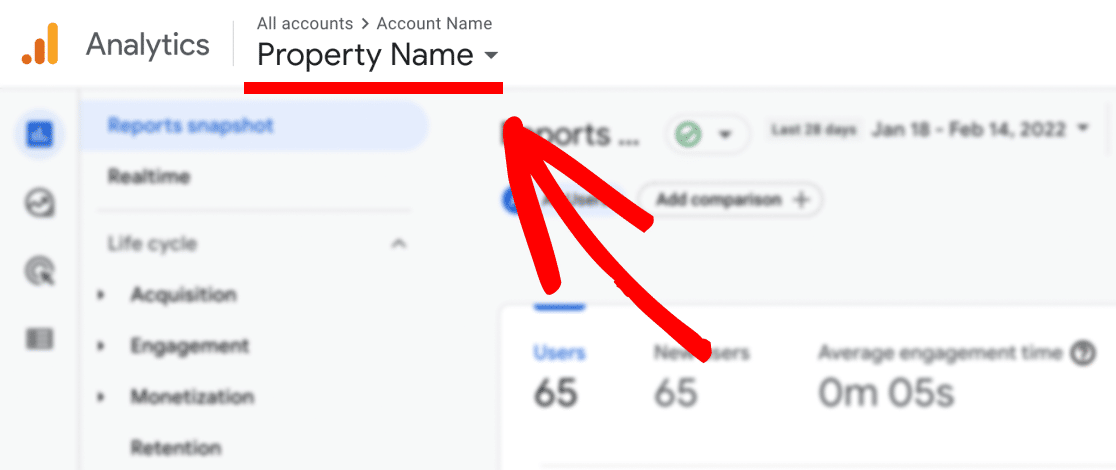
Step 2: Make sure the correct property is selected in the account picker.

Step 3: Next, click into Reports » Realtime.

What You Can Do With The Realtime Report
- Make sure that you are being correctly tracked in real time on desktop and mobile. Note: App data may be delayed due to batching (to converse battery life).
- Ensure a promotion is driving traffic to your site as it happens.
- Monitor how users are finding your website
- Monitor and test if events or conversions are being tracked as expected.
- Randomly view individual user activity of site visitors currently viewing your site.

The Realtime report is organized into cards, which may be laid out differently for you depending on the size of your browser. Regardless, they will be in the following order:
- Overview card of users within the last 30 minutes
- Users by source card
- Users by audience card
- Views by page title and screen name card
- Event count card
- Conversions count card
- User property card
Overview of the Realtime Cards
In the first card, you’ll see the number of active users in the last 30 minutes, users per minute and users by device. Off to the side, there is also location map of your site visitors.

In the next set of cards, you’ll see an overview of how your site visitors are finding your website (Users by source, medium, or campaign), any audiences configured (All Users or New Users) and what content your site visitors are engaging with (Views by Page title or screen name).

In the last set of cards, you’ll be able to view the events and conversions that your site visitors are triggering on your website, as well as any user properties.

The GA4 Realtime report also offers the ability to randomly view activity of single users who are currently visiting your site right now. To view the snapshot click on the View user snapshot button in the top right corner.

This will take you to an overview of a random user where you can view at a glance how the user came to your site, what events the user has triggered, where they’re based, and what device is being used.

To switch to another random user, click on the arrows located within the box at the top left of the page:

That’s it! Now you know all about the Realtime Reporting Reports in Google Analytics! Ready to learn about Forms Tracking in Google Analytics? Check out our guide How to Track Your WordPress Form Conversions in Google Analytics.

